- Published
- Reading time
- 13 min read
SaaS Monitoring: A Practical Guide for Small Teams
- Written by
- Türkü Şimşek
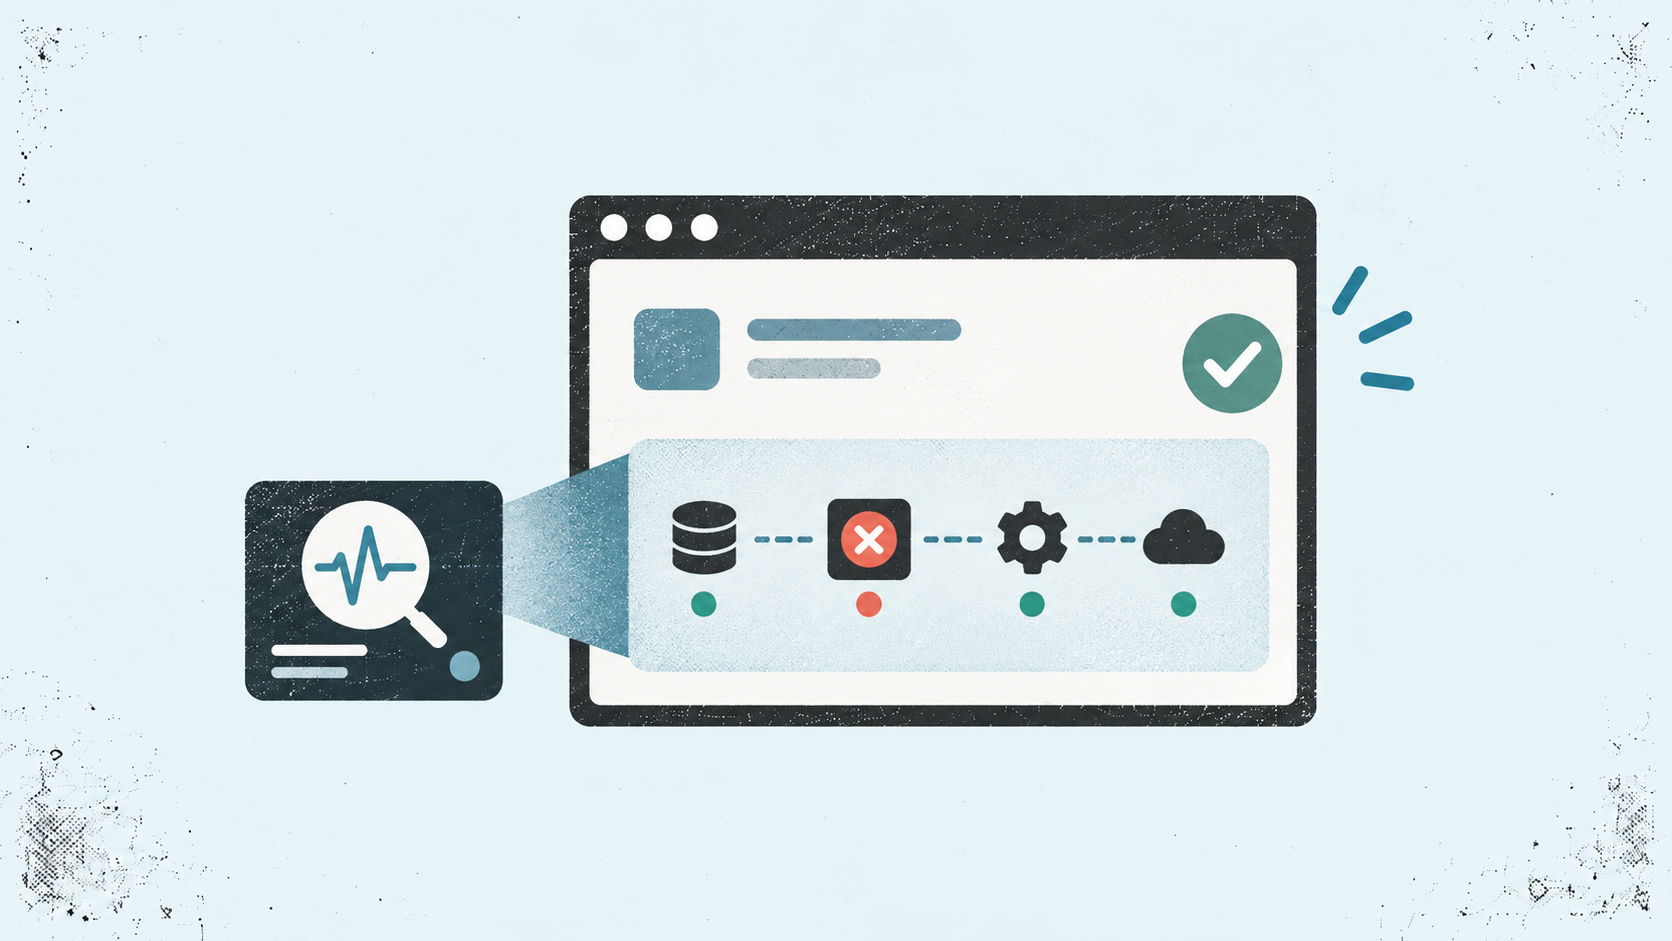
SaaS monitoring is the practice of tracking your application’s availability, performance, and health. It combines checks and application signals to help you detect failures, investigate problems, and respond. It also covers the dependencies your product needs to work.
Your homepage loads. Your server looks healthy. But a customer can’t finish checkout.
That’s the challenge with running a SaaS product: “online” doesn’t always mean “working.”
If you’re a solo founder or part of a micro SaaS team, you probably can’t watch every dashboard. You need a manageable setup that tells you when something needs attention.
Start with the questions your users care about. Can they sign in? Does the API respond quickly? Did the report they requested finish processing?
This guide focuses on monitoring the SaaS product you build and run. We’ll cover what to check first, which metrics help, and how to turn signals into useful alerts.
Quick Facts by AppKeepr
- SaaS monitoring checks whether your product is available and working as expected. It covers uptime, performance, errors, and important workflows.
- A healthy server doesn’t prove a healthy product. Login, checkout, or background jobs can fail while your homepage stays online.
- Start with what matters most to users. Prioritize the journeys and endpoints whose failure would cause the most disruption.
- Combine external checks with application signals. Uptime checks show reachability. Errors, logs, and task results provide additional context.
- Monitoring and alerting serve different roles. Monitoring tracks conditions. Alerts bring selected changes to your attention.
- AppKeepr brings developer updates together. Built-in uptime and expiry monitoring complement events from supported tools and your backend.
- Deeper diagnosis may require other tools. Traces, performance analysis, and real user monitoring help investigate problems beyond basic availability.
What Is SaaS Monitoring?
SaaS monitoring helps you understand whether your application is available, responsive, and doing what users expect.
It combines different types of evidence. An uptime check might reveal an unreachable endpoint. Error tracking might show failed requests. A workflow test might uncover a broken checkout.
Each answers a different question. Together, they give you a more useful picture of your product’s health.
For an indie developer, the goal is practical: notice important problems, collect enough context to investigate, and respond.
Your Product and Its Dependencies
Your application relies on more than your own code. Payment processing, authentication, email, and storage services may all affect the user experience.
A failed payment request could come from your backend, an integration mistake, or the provider itself. Monitoring helps you narrow down where to investigate.
Start by identifying which dependencies support your most important workflows. Their failures deserve attention even when your own server remains online.
Internal and External Monitoring
Internal monitoring collects signals from inside your application and infrastructure. External monitoring checks your product from outside.
Perspective | Example | What it helps reveal |
Internal | Application errors, logs, and job results | Failures and diagnostic context within your system |
External | An HTTP check or a simulated login | Whether an endpoint or tested workflow works from the check’s location |
Neither view tells the whole story. An endpoint check may pass while a scheduled report never runs. Application logs may show no error because the missing job never started.
If you ask me, a small team should combine external checks with application signals and checks for expected job completion. Expand coverage as specific gaps appear.
What Should You Monitor First?
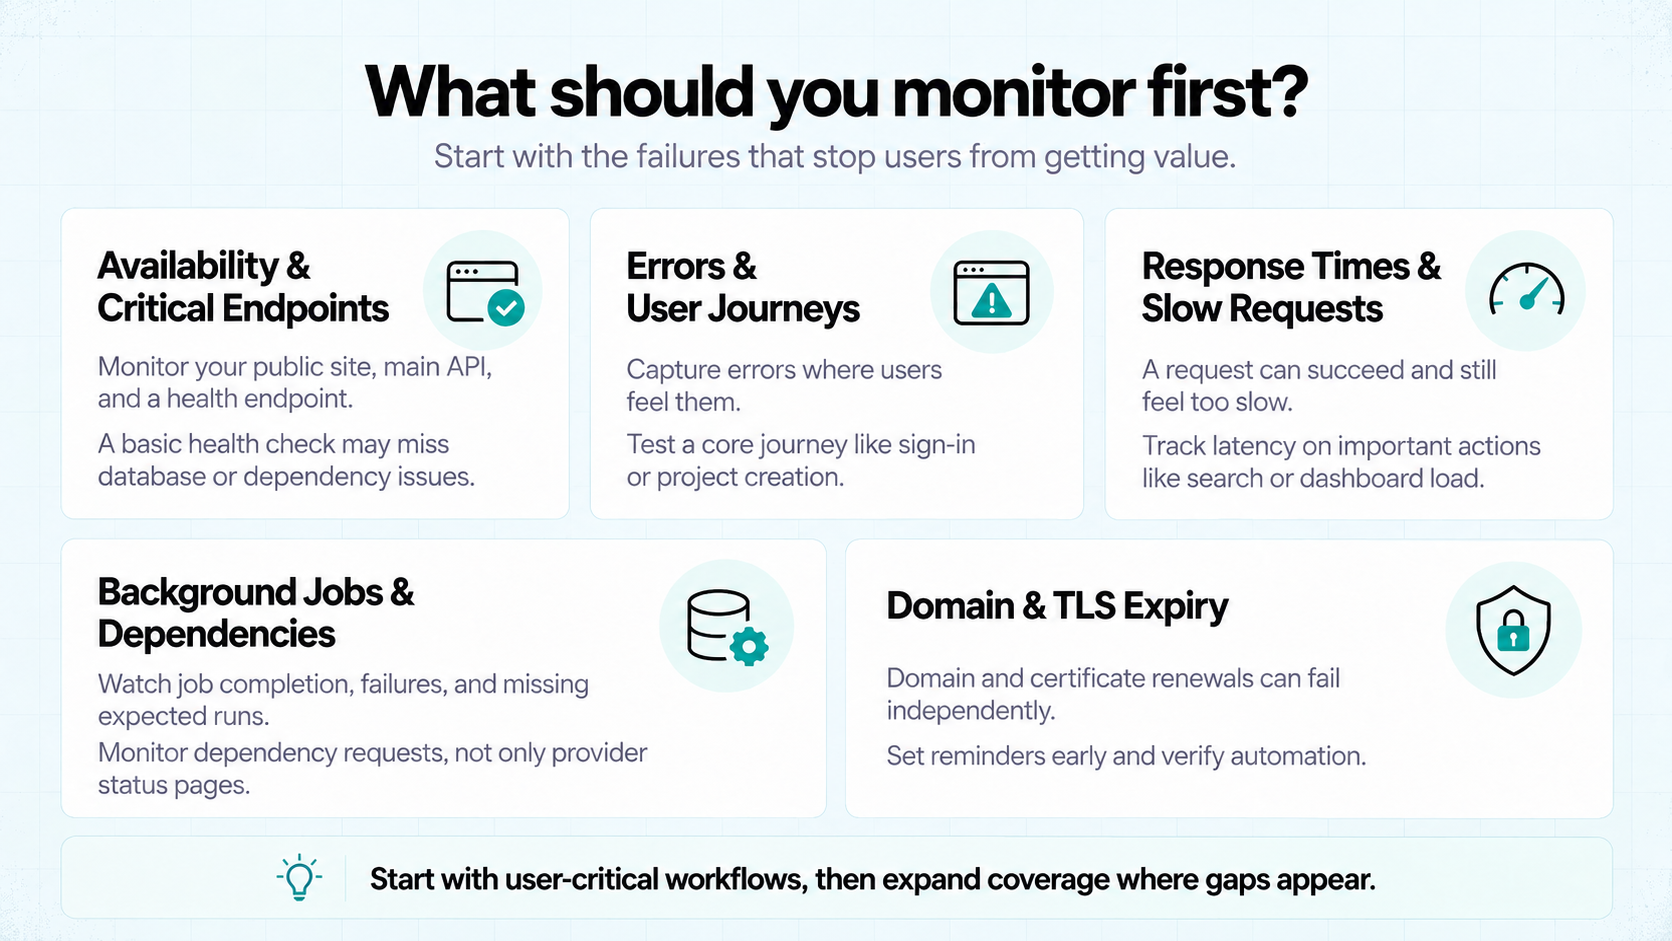
Start with the problems that would stop users from getting value from your product.
For a report-generation tool, that might mean failed requests, missing background jobs, or results that never become available. For a collaboration app, sign-in and message delivery may come first.
Choose checks around those outcomes. Here are five areas to consider.
Availability and Critical Endpoints
Check the endpoints your product needs to function. Your homepage is useful, but it may be served separately from your API.
A starting list might include:
- Your public website.
- Your main API.
- A health endpoint designed to report relevant service conditions.
Know what each check measures. A basic health endpoint may confirm that a process is running without checking its database or dependencies.
Errors and User Journeys
Capture application errors where they affect users. Include enough context to identify the application, environment, and affected operation.
Then consider tests for your most important journey. For example, can a test account sign in and create a project?
A synthetic test runs a predefined workflow. It can catch problems that a simple HTTP check misses.
Keep tests isolated from real customer activity. Payment workflows should use appropriate test environments or carefully controlled checks.
Response Times and Slow Requests
An endpoint can respond successfully and still feel unusable.
Measure response times for important operations, such as loading a dashboard or retrieving search results. Compare them with normal behavior and your product’s requirements.
Google’s site reliability engineering guide to monitoring highlights latency, traffic, errors, and saturation as four useful signals. They provide a foundation, rather than a requirement to build a large monitoring stack.
Background Jobs and Dependencies
A working frontend won’t tell you whether a scheduled report ran.
Track job completion, failures, and missing expected runs. A failure alert alone won’t catch a job that never starts.
For dependencies, watch the requests your application makes. A provider’s status page adds context, but it doesn’t prove your own integration is working.
Domain and TLS Expiry
Domain registration and TLS certificates have separate expiry dates. Either can disrupt access if renewal fails.
Set reminders early enough to investigate renewal issues. Automated renewal reduces manual work, but it still deserves verification.
Which SaaS Monitoring Metrics Matter?
Choose metrics that help you answer a question or make a decision. A crowded dashboard is hard to use during a problem.
For a small SaaS product, start with availability, latency, errors, and important task results.
Availability, Latency, and Error Rate
Metric | What it measures | How to use it |
Availability | The proportion of checks or requests that meet your success criteria | Identify interruptions within the measured scope |
Latency | How long an operation takes | Detect slow endpoints and user journeys |
Error rate | The proportion of requests or operations classified as failures | Spot changes in reliability |
Traffic | Request or operation volume | Understand demand and put other signals in context |
Define what counts as success. A reachable homepage and a completed checkout measure different things.
For latency, averages can hide slow experiences. A 95th-percentile response time, or p95, shows the duration at or below which 95% of measured requests fall.
Compare similar operations over a suitable time window. Your report-generation endpoint may have different expectations from your login endpoint.
Google’s guide to service-level objectives explains how to choose reliability measurements around user needs.
Task Completion and Recovery Time
Track whether important background jobs finish successfully and on time. Include missing runs, rather than counting only jobs that report a result.
You can also record how long incidents take to resolve. Define when an incident starts and what counts as recovery, so comparisons remain meaningful.
Business metrics such as MRR and churn can reveal changes worth investigating. On their own, they don’t identify a technical failure or its cause.
My recommendation is to choose a few meaningful measurements first. Set targets around your users’ needs, then adjust them as you learn.
Build a Small-Team Monitoring Setup
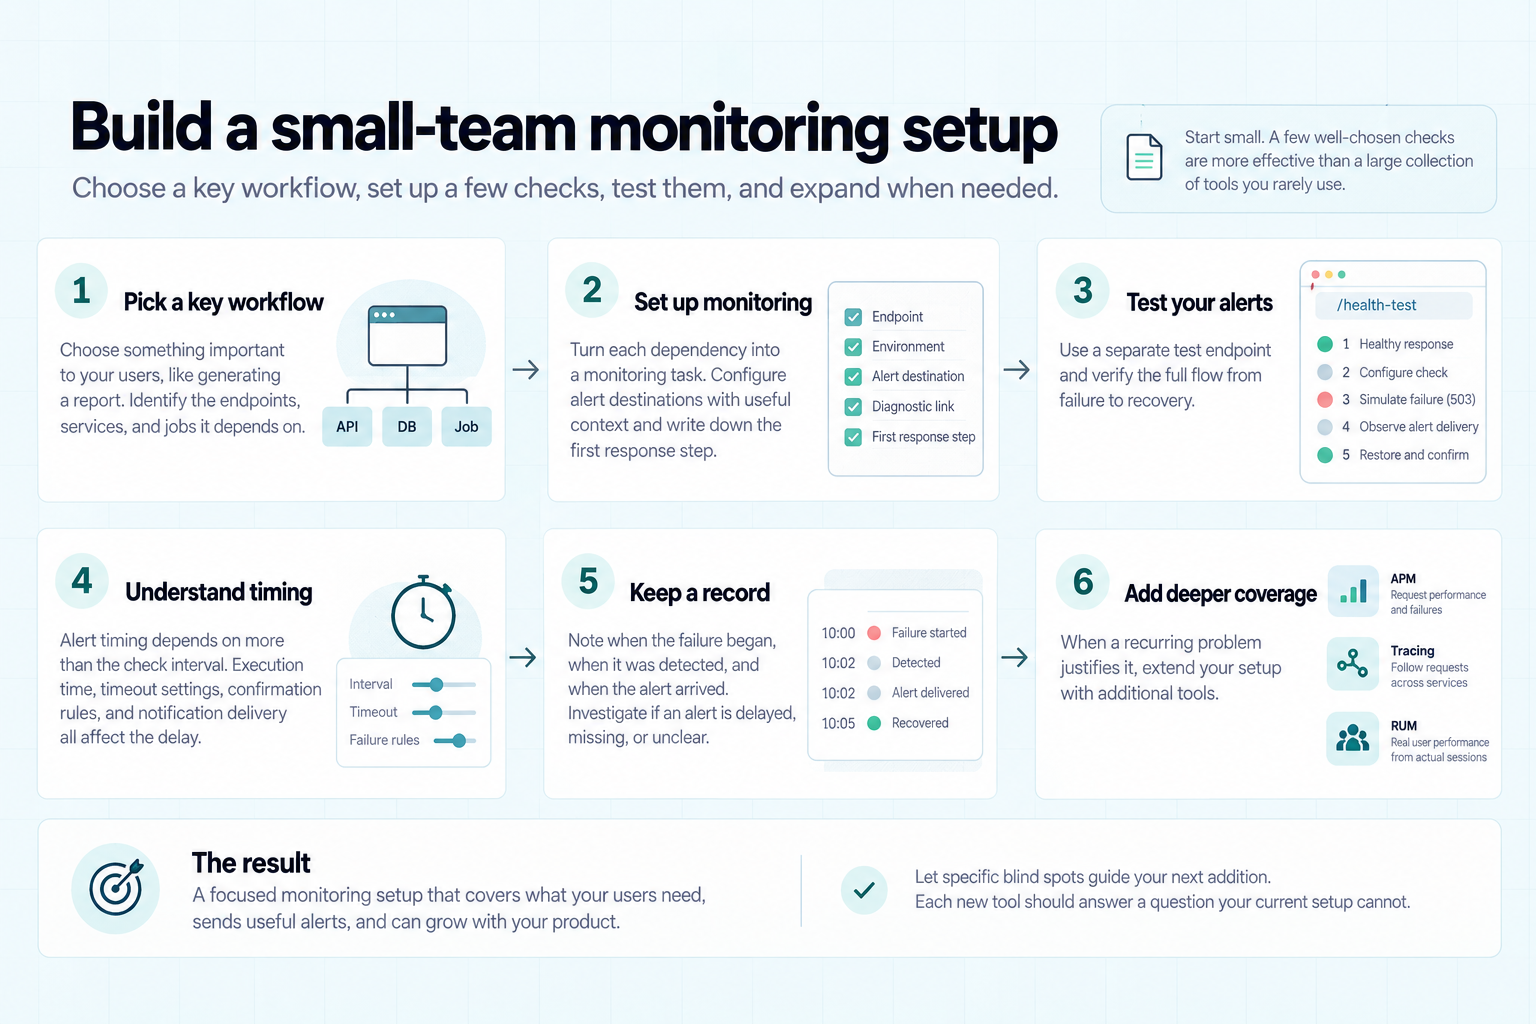
Start with a few checks tied to real user needs. Then verify what they detect and where their coverage ends.
For a solo founder, a manageable setup is easier to maintain than a collection of tools you rarely use.
Your Starting Checklist
Choose one important workflow, such as generating a report. Identify the endpoints, services, and jobs it depends on.
Use this checklist to turn those dependencies into monitoring tasks:
Priority | What to configure | What it won’t establish |
First | External checks for your website and main API | Whether every feature works |
First | Error tracking for important application operations | Whether a task never started |
First | Completion and missed-run checks for essential jobs | Whether the generated result is correct |
First | Domain and TLS expiry reminders | Whether renewal will succeed |
Next | A synthetic test for your core user journey | Whether every customer experiences the same result |
As needed | Performance monitoring and tracing | Complete coverage without suitable instrumentation |
Assign a destination for each alert. Include the application, environment, observed problem, and a useful diagnostic link.
Write down the first response step, even if the person responding is you.
Walk Through an Outage and Recovery
Before relying on an uptime alert, test it against an endpoint you control. Use a separate test endpoint so customers are unaffected.
Follow this sequence:
- Establish a healthy response. Confirm the endpoint returns the HTTP status your monitor expects.
- Configure the check. Set the destination for alerts and confirm that notifications are enabled.
- Simulate a failure. Temporarily make the test endpoint return HTTP 503, and confirm that your monitor classifies that response as unhealthy.
- Observe detection and delivery. Record when the failure began, when the monitor detected it, and when the alert arrived.
- Restore the endpoint. Return it to the expected response and check for a recovery notification, if configured.
Before testing, review your monitor’s interval, timeout, and failure rules. Some tools alert after one failed check. Others wait for repeated failures or additional confirmation.
The check interval alone doesn’t determine how quickly an alert arrives. Execution time, confirmation rules, and notification delivery also affect the delay.
A successful test confirms detection of that failed HTTP response and delivery through the configured notification path. It does not prove that login, checkout, or background processing works.
Keep a short record of the results. If an alert is delayed, missing, or unclear, investigate before relying on it.
Expand When You Find a Gap
Add deeper coverage when a recurring problem justifies it.
- Application performance monitoring (APM) tracks application performance, including request durations and failures.
- Distributed tracing follows a request across services to reveal delays or failures.
- Real user monitoring (RUM) collects performance information from actual user sessions.
Let specific blind spots guide your next addition. Each new tool should answer a question your current setup cannot.
Turn Monitoring Signals Into Useful Alerts
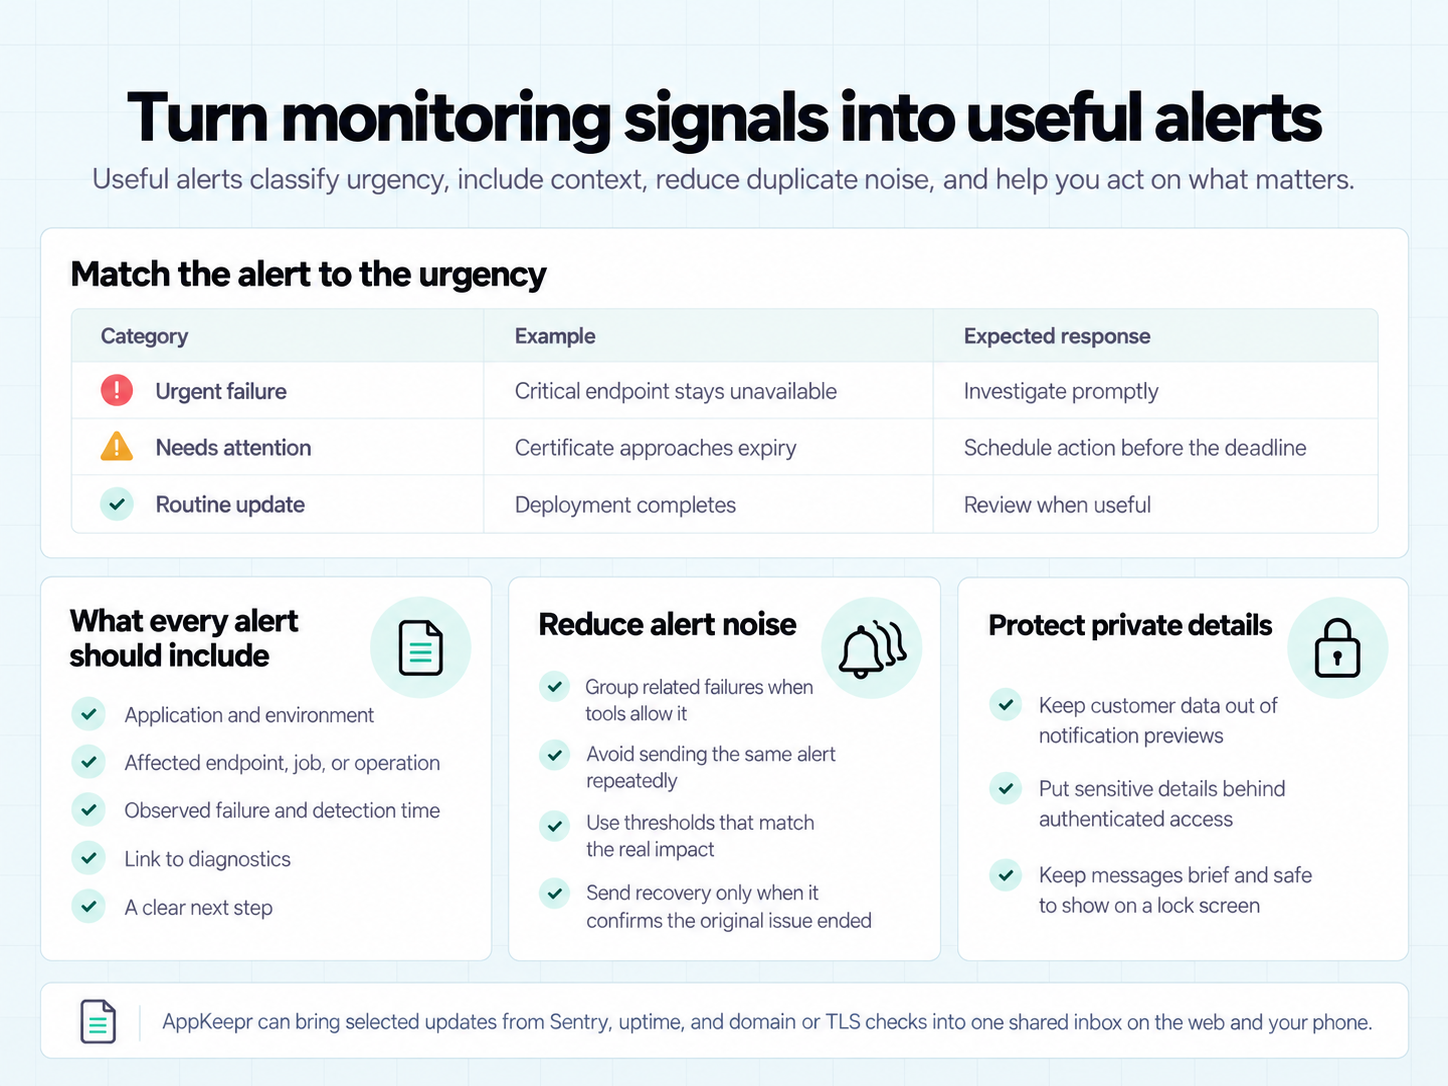
Monitoring can collect hundreds of signals. Only some need your immediate attention.
For a solo founder, every interruption competes with development, support, and the rest of your day. Make each alert worth opening.
Separate Failures From Routine Updates
A production outage and a successful deployment shouldn’t demand the same response.
Start with simple categories:
Category | Example | Expected response |
Urgent failure | A critical endpoint stays unavailable | Investigate promptly |
Needs attention | A certificate approaches expiry | Schedule action before the deadline |
Routine update | A deployment completes | Review when useful |
Use thresholds that match the impact. Repeated failures may justify an alert where one brief timeout does not.
Recovery notifications can help you understand when a detected problem ends. Confirm that the recovered condition matches what originally failed.
Include Context and a Next Step
An alert saying “Something went wrong” leaves you starting from scratch.
Include the essentials:
- Application and environment.
- Affected endpoint, job, or operation.
- Observed failure and detection time.
- A link to relevant diagnostics.
Keep private customer data out of notification previews. Put sensitive details behind authenticated access.
Reduce Duplicate Alerts
Where your monitoring tools support it, group related failures and avoid sending the same alert repeatedly.
The Prometheus alerting guide recommends focusing alerts on symptoms that affect users. It also advises linking to diagnostic information and allowing for brief fluctuations.
For example, one database problem may trigger failures across several endpoints. Grouping those alerts can make the incident easier to follow.
My recommendation is to review alerts after incidents. Keep the ones that helped, improve unclear messages, and adjust rules that created noise.
Bring Important Updates Together With AppKeepr
You might use one tool to detect application errors and another to track deployments. AppKeepr gives those selected updates a shared inbox, available on the web and your phone.
For example, a configured Sentry Issue Alert can send an error update with an issue link. Your backend can also send a custom message when an important job fails.
AppKeepr includes uptime checks for public endpoints and domain and TLS expiry reminders. Route updates to a channel and subscribe to receive its future notifications.
These features help you follow what needs attention. Keep your diagnostic tools available to investigate the cause, and use separate checks for complete user journeys or missing scheduled jobs.
Common SaaS Monitoring Mistakes
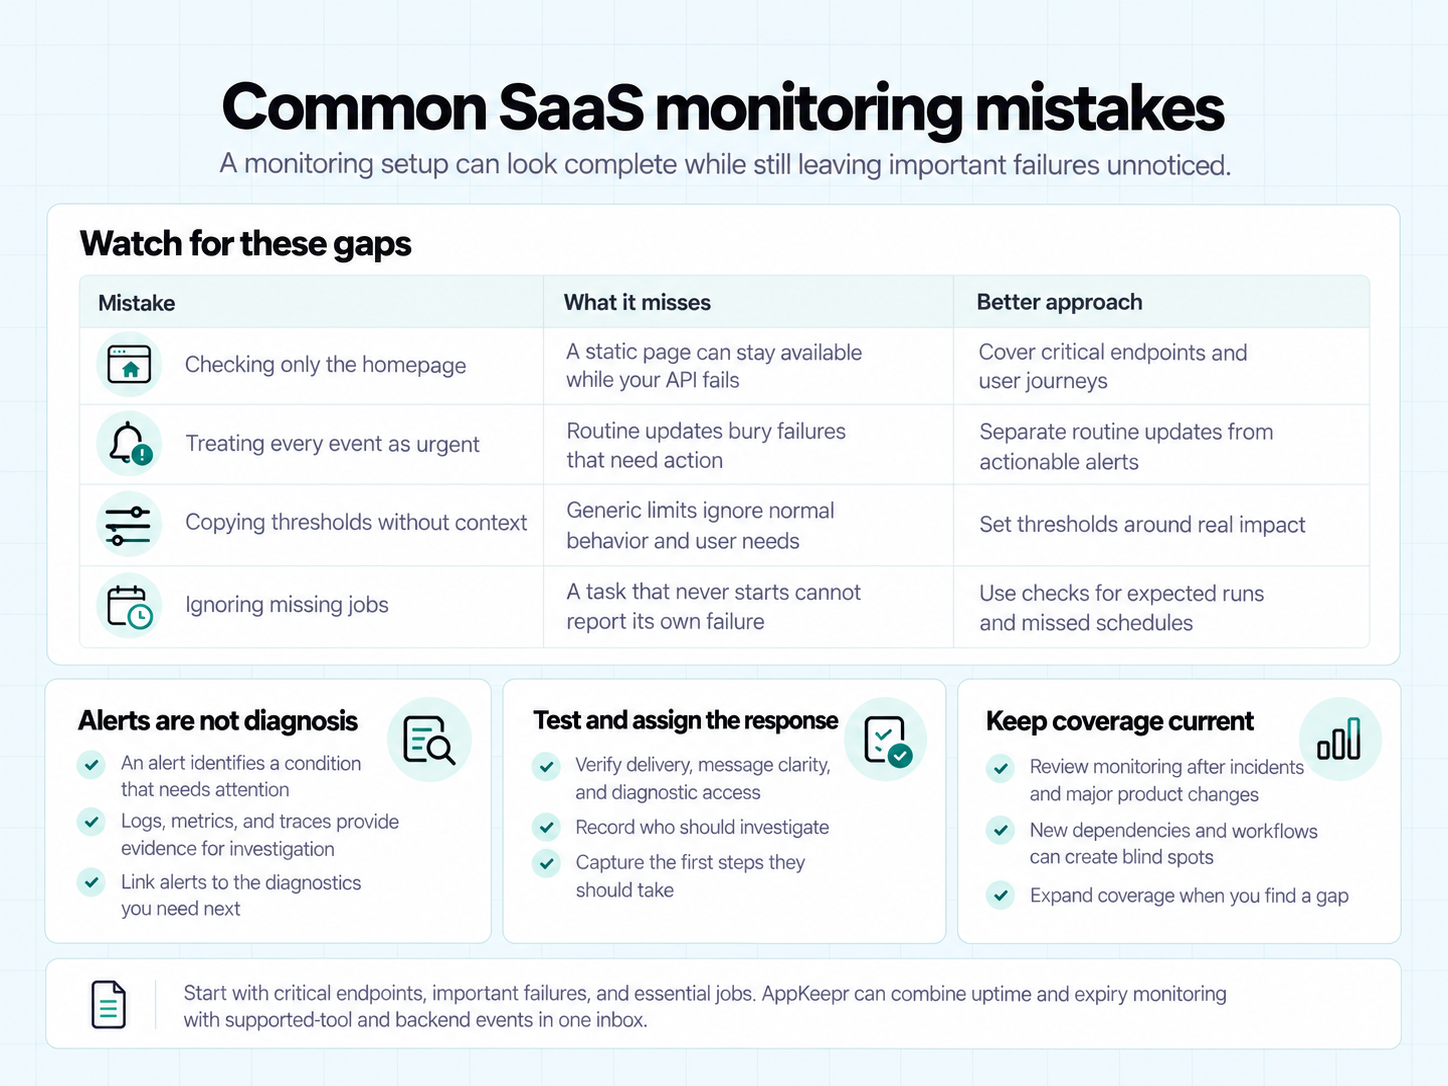
A monitoring setup can look complete while leaving important failures unnoticed. Watch for these gaps:
- Checking only the homepage. A static page may stay available while your application’s API fails. Cover the endpoints and journeys users depend on.
- Treating every event as urgent. Separate routine updates from failures that require action.
- Copying thresholds without context. Choose limits around normal behavior and user needs.
- Ignoring missing jobs. A task that never starts cannot report its own failure. Use a separate check to detect missing expected runs.
- Confusing alerts with diagnosis. An alert identifies a condition that needs attention. Logs, metrics, and traces provide evidence for investigating it. OpenTelemetry’s guide to signals explains these complementary types of data.
- Skipping alert tests. Verify delivery, message clarity, and access to diagnostic details.
- Leaving the response unclear. Record who should investigate and the first steps they should take.
Review your setup after incidents and major product changes. A new dependency or workflow may introduce a failure your existing checks cannot detect.
Conclusion: Start With the Signals That Matter
SaaS monitoring starts with understanding what your users need to work reliably. Check critical endpoints, track important failures, and confirm that essential jobs finish.
Build a setup you can maintain. Test your alerts, keep diagnostic information accessible, and expand coverage when you find a gap.
AppKeepr helps bring operational updates into your daily workflow. Combine its uptime and expiry monitoring with events from supported tools and your backend.
Start using AppKeepr for free and follow your important app updates in one inbox, on the web and your phone.
SaaS Monitoring FAQ
Uptime monitoring checks whether an endpoint is reachable and meets defined response criteria. SaaS monitoring also covers performance, errors, dependencies, and important workflows. Your homepage can pass an uptime check while checkout fails, so combine availability checks with application signals and tests for critical user journeys.
Start with your website, main API, and most important user journey. Add error tracking, essential background-job checks, and domain and TLS expiry reminders. Configure alerts for failures that need action, then test detection and delivery. Expand your setup when you discover a specific blind spot.
Choose an interval based on the impact of failure and how quickly you need to respond. Critical endpoints generally need more frequent checks than low-priority pages. Consider check duration, request limits, and cost, too. Check frequency alone doesn’t determine detection time; confirmation rules and notification delivery add delay.
Yes. Free plans and open-source tools can cover parts of a small product’s monitoring needs. Check limits on monitored endpoints, check frequency, data retention, and notifications. Self-hosted tools also require infrastructure and maintenance. Confirm that your starting setup covers your most important failure scenarios.
Rate this article
Share