- Published
- Reading time
- 14 min read
Site Uptime Monitoring: Catch Downtime Before Users Report It
- Written by
- Türkü Şimşek
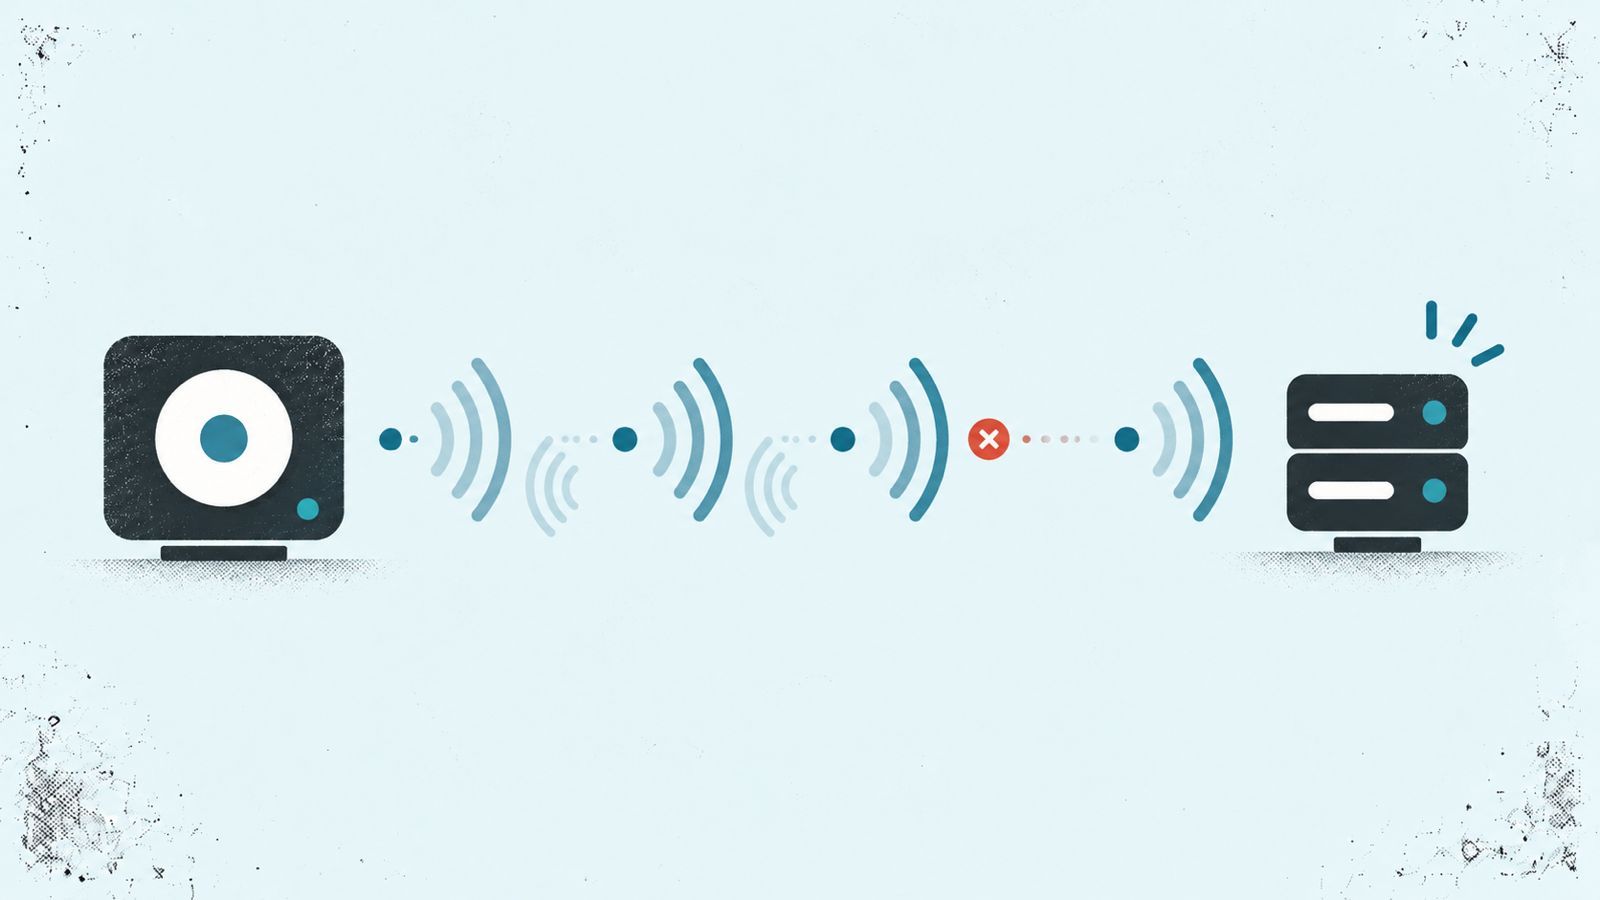
Site uptime monitoring checks your website or API at regular intervals and can alert you when failures meet its configured alert rules. It helps you detect availability problems without manually refreshing your site. Detection speed depends on the check interval, timeout, and alert settings.
When you run a small SaaS, you’re often the developer, support team, and person responsible for keeping everything online. You can’t watch your site all day.
A deployment might leave your API unreachable while you’re working on the next feature. Without monitoring, your first clue could be a customer’s message.
Site uptime monitoring gives you another way to spot trouble. Scheduled checks look for availability failures, and notifications tell you when something needs attention.
The useful part is choosing checks that reflect what your users depend on. Monitoring one page gives you information about that page; it doesn’t prove your whole product works.
This guide explains which URLs to monitor, how to configure useful alerts, and what to look for in a monitoring service.
Quick Facts by AppKeepr
- Start with essential URLs. Monitor your public site and the API endpoints your users rely on.
- Check frequency affects detection. An outage can begin between checks, so alerts may arrive after downtime starts.
- Set a sensible timeout. A slow response may count as a failed check if it exceeds the configured limit.
- Know what success means. An HTTP 200 response doesn’t prove that login, checkout, or other workflows work.
- Test your notifications. Verify that failure and recovery alerts reach you through your chosen channel.
- Choose coverage carefully. Check locations, alert settings, and plan limits before selecting a service.
How Site Uptime Monitoring Works
Site uptime monitoring sends scheduled requests to a website or API. Each check compares the result with the monitor’s rules to decide whether the endpoint is healthy.
Scheduled Checks and Expected Responses
For a basic HTTP check, the monitor requests a URL and waits for a response. It usually evaluates the response status and whether it arrived within the allowed time.
Depending on the service, a check may fail because:
- The domain cannot be resolved to an IP address.
- The connection cannot be established.
- The server returns an unexpected HTTP status.
- The response takes longer than the configured timeout.
Some services also check for expected text in the response. This can help detect a page that loads but displays an error message.
Scheduled checks can go further than a single request. Amazon CloudWatch’s synthetic monitoring documentation describes scripts that check endpoints and simulate customer actions. These broader tests require capabilities beyond a basic uptime check.
From a Failed Check to a Recovery Alert
A failed check becomes an alert according to the service’s settings. Some tools notify you after one failure. Others can require repeated failures or confirmation from another location.
Here’s a simple example:
- A monitor checks your API every minute.
- Your API becomes unreachable between checks.
- A later check fails, triggering the configured alert process.
- When the API responds successfully again, the service may send a recovery notification.
The alert time is not necessarily the moment the outage began. Check intervals, timeouts, confirmation rules, and notification delivery all affect the delay.
An outage that starts and ends between checks may go undetected. Monitoring gives you evidence from scheduled observations, so it helps to understand exactly what your chosen service checks.
Which Pages and Endpoints Should You Monitor?
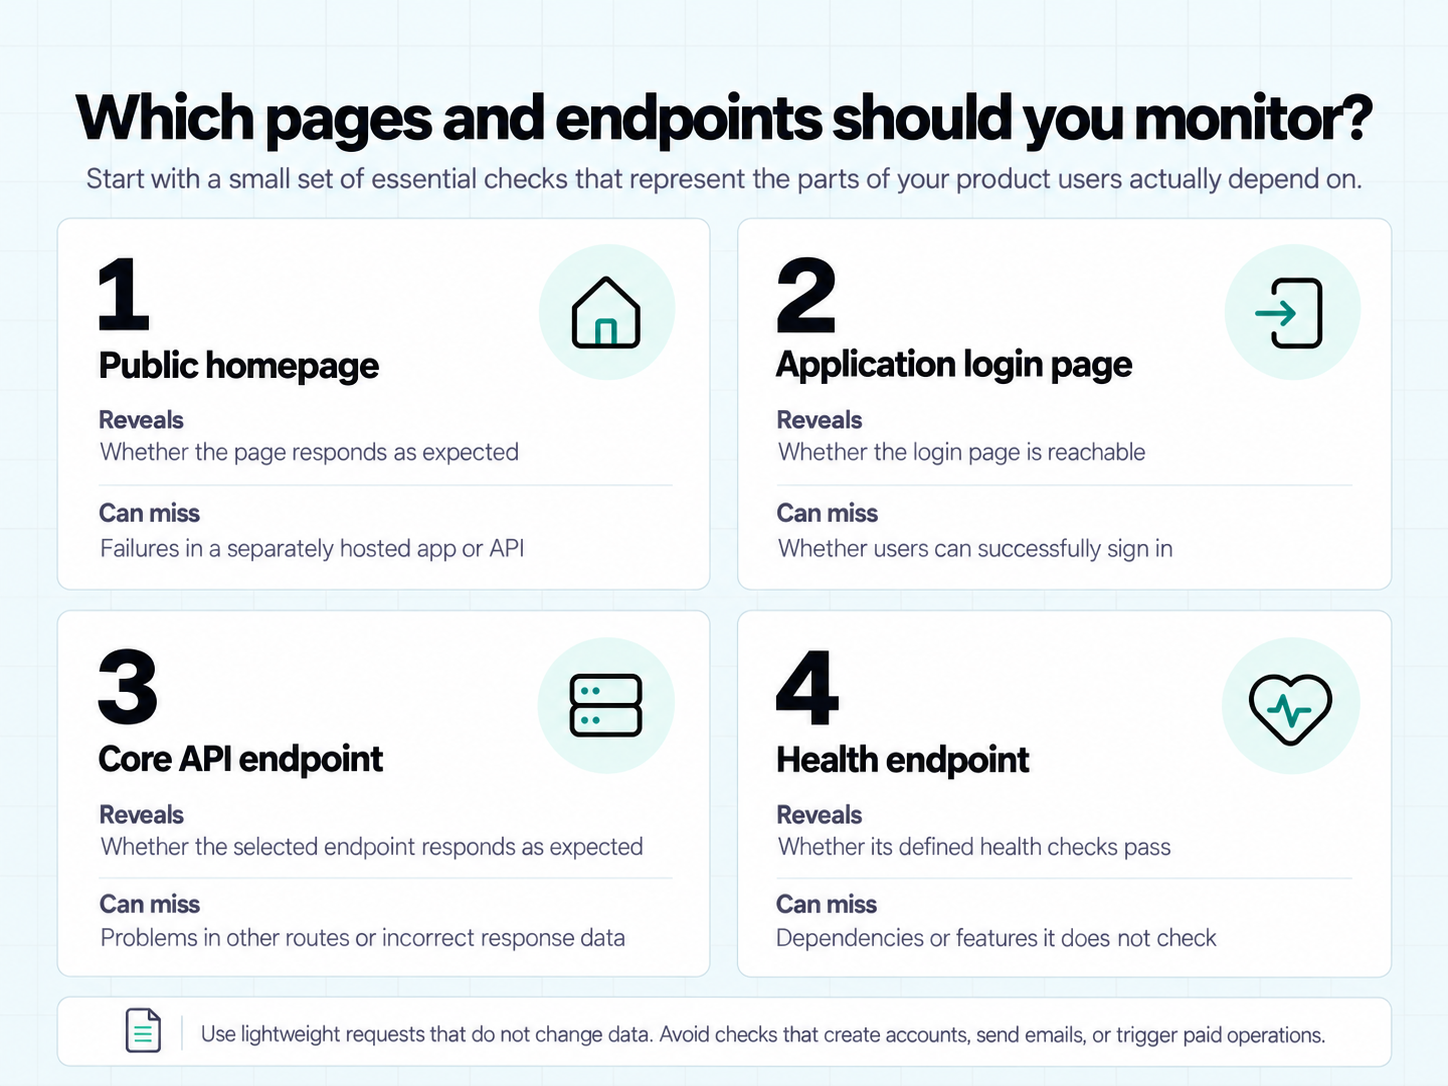
Start with a few URLs that represent essential parts of your product. For a solo founder, a manageable set of useful checks is easier to maintain than dozens of overlapping monitors.
Start With Your Public Site and Core API
Your public site and application may run on separate infrastructure. A working landing page tells you little about an API hosted elsewhere.
Choose URLs based on what users need to access. For a small SaaS, your starting set might look like this:
URL or endpoint | What the check can reveal | What it can miss |
Public homepage | Whether that page responds as expected | Failures in a separately hosted app or API |
Application login page | Whether the login page is reachable | Whether users can successfully sign in |
Core API endpoint | Whether the selected endpoint responds as expected | Problems in other routes or incorrect response data |
Health endpoint | Whether its defined health checks pass | Dependencies or features it does not check |
Use lightweight requests that do not change data. Avoid pointing a basic monitor at an action that creates accounts, sends emails, or starts a paid operation.
Choose a Health Endpoint That Reveals Useful Failures
A health endpoint is a URL designed to report the condition of your application. Its value depends on what happens behind that URL.
An endpoint that always returns “OK” may show that the application can respond. It will not tell you whether the database is reachable.
If database access is essential to serving users, a lightweight database check can make the result more useful. Keep the response brief and avoid exposing credentials, internal addresses, or detailed errors.
If you ask me, the best starting question is: “What failure would make this product unusable?” Choose checks that help reveal those failures, then add coverage as your product grows.
How to Set Up Site Uptime Monitoring
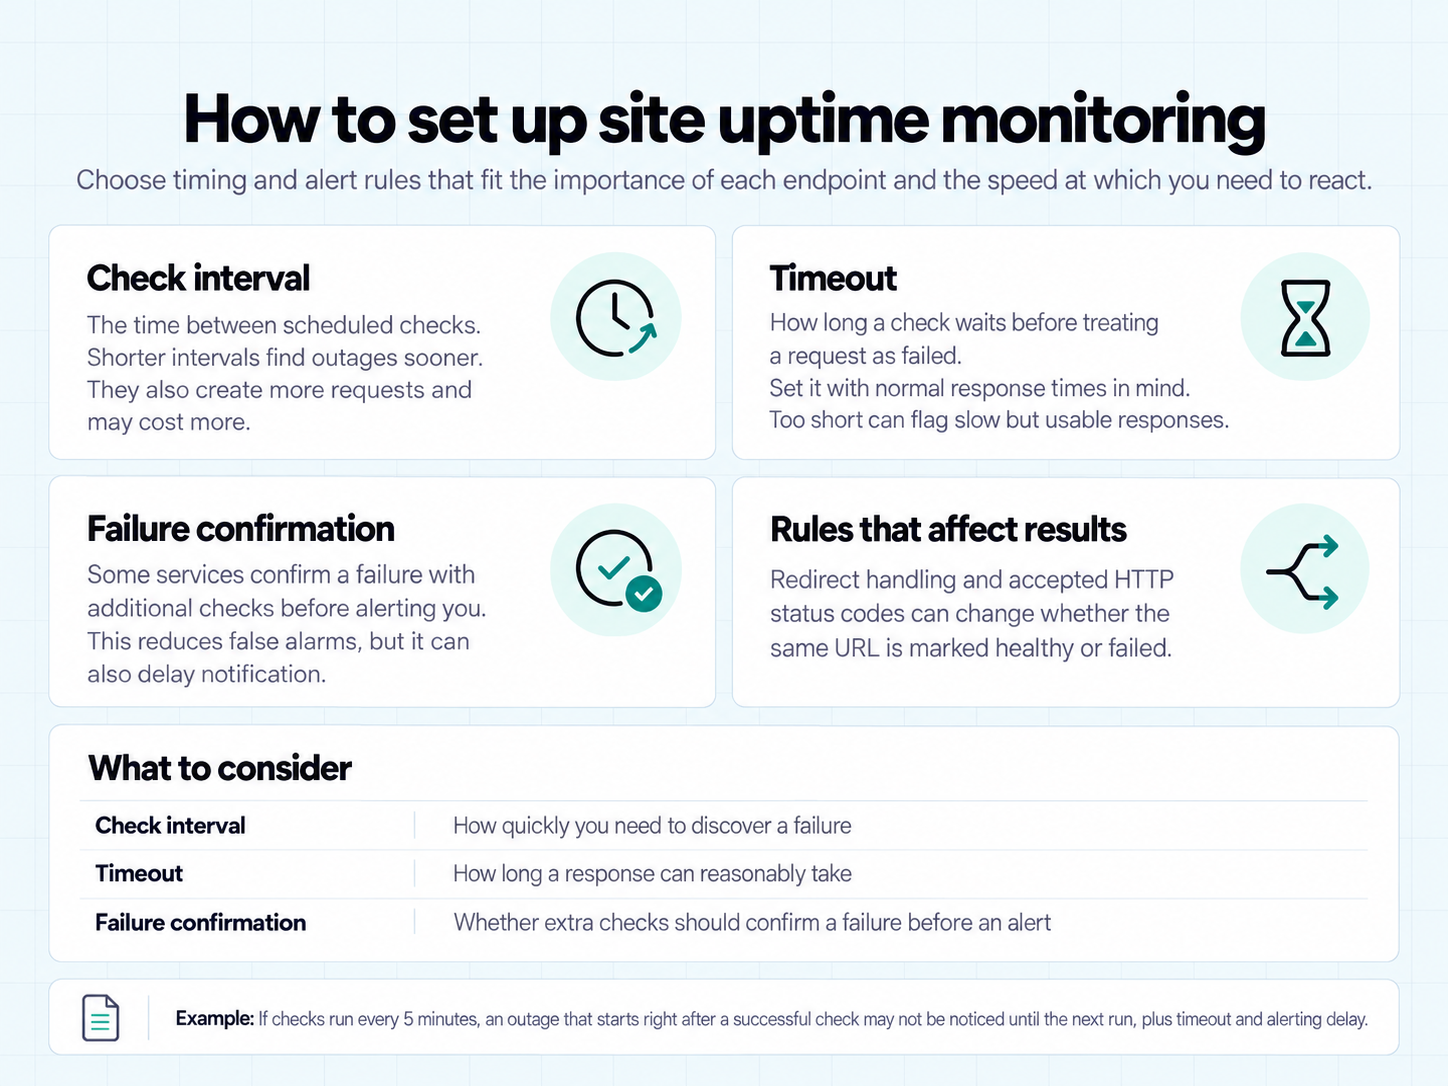
Once you’ve chosen your URLs, configure when checks run and how failures reach you. A monitor is only useful if you understand its rules and receive its alerts.
Choose Check Intervals and Timeouts
The check interval is the time between scheduled checks. The timeout is how long a check waits before treating an unfinished request as a failure.
These settings serve different purposes:
Setting | What to consider |
Check interval | How quickly you need to discover a failure |
Timeout | How long a response can reasonably take |
Failure confirmation | Whether additional checks should confirm a failure before an alert |
Suppose your monitor checks every five minutes. If an outage starts just after a successful check, the next request may not begin until almost five minutes later. The timeout and alert process can add further delay.
Shorter intervals create more requests and may require a different pricing plan. Choose an interval that suits the endpoint’s importance and your budget.
Set the timeout with normal response times in mind. A very short timeout can flag responses that are slow but still usable. A long timeout can delay the discovery of an unresponsive endpoint.
Also check how the service handles redirects and HTTP status codes. The same URL can produce different monitoring results under different rules.
Configure Alerts You Can Act On
Choose a notification channel you’ll notice during your normal day. For a solo founder, that might be a phone notification. A small team may prefer a shared channel with a clear owner.
Useful alerts should help you identify:
- Which endpoint failed.
- When the failure was detected.
- What failed, such as a timeout or unexpected status.
- Whether the endpoint has recovered.
Where supported, failure confirmation can reduce alerts caused by brief connection problems. It also adds detection time, so consider that tradeoff before enabling it.
Check repeated-alert behavior too. You should know whether the service sends one notification per incident, reminders, or a message after every failed check.
Test the Check and the Notification
Saving a monitor does not prove that the whole alert process works. Test it before relying on it.
Use this checklist:
- Confirm a healthy result. Make sure the intended URL passes the check.
- Use a controlled failure. Test with a dedicated endpoint or staging environment, without disrupting users.
- Verify delivery. Check that the failure notification reaches the right device or channel.
- Restore the expected response. Confirm that recovery is detected and reported, where supported.
- Check ownership. Make sure someone knows they are responsible for responding.
A built-in test notification can verify delivery. A controlled failed check also tests the path from detection to notification. Both are useful, but they verify different parts of the setup.
Example: Monitoring a Small Reporting SaaS
Imagine you run a reporting app called ReportNest. Your public homepage explains the product, while a separate API serves customer reports.
This is an illustrative setup, not a recorded test or an AppKeepr configuration. Available settings depend on your monitoring service.
Check | Example URL | Expected result | Alert recipient |
Public homepage |
| HTTP 200 within ten seconds | Founder’s phone |
API health endpoint |
| HTTP 200 within ten seconds | Founder’s phone and a shared operations channel |
In this example, both checks run every minute. The API health endpoint performs a lightweight database check. It returns HTTP 503 if that essential dependency is unavailable.
To verify the setup, use a staging endpoint that you control. Make it return 503, confirm that a failure alert arrives, then restore HTTP 200 and check for a recovery notification.
These checks cover homepage availability and the API’s defined health conditions. They would not reveal a stopped report-generation job unless you added a separate check for job completion.
What Uptime Checks Can Miss
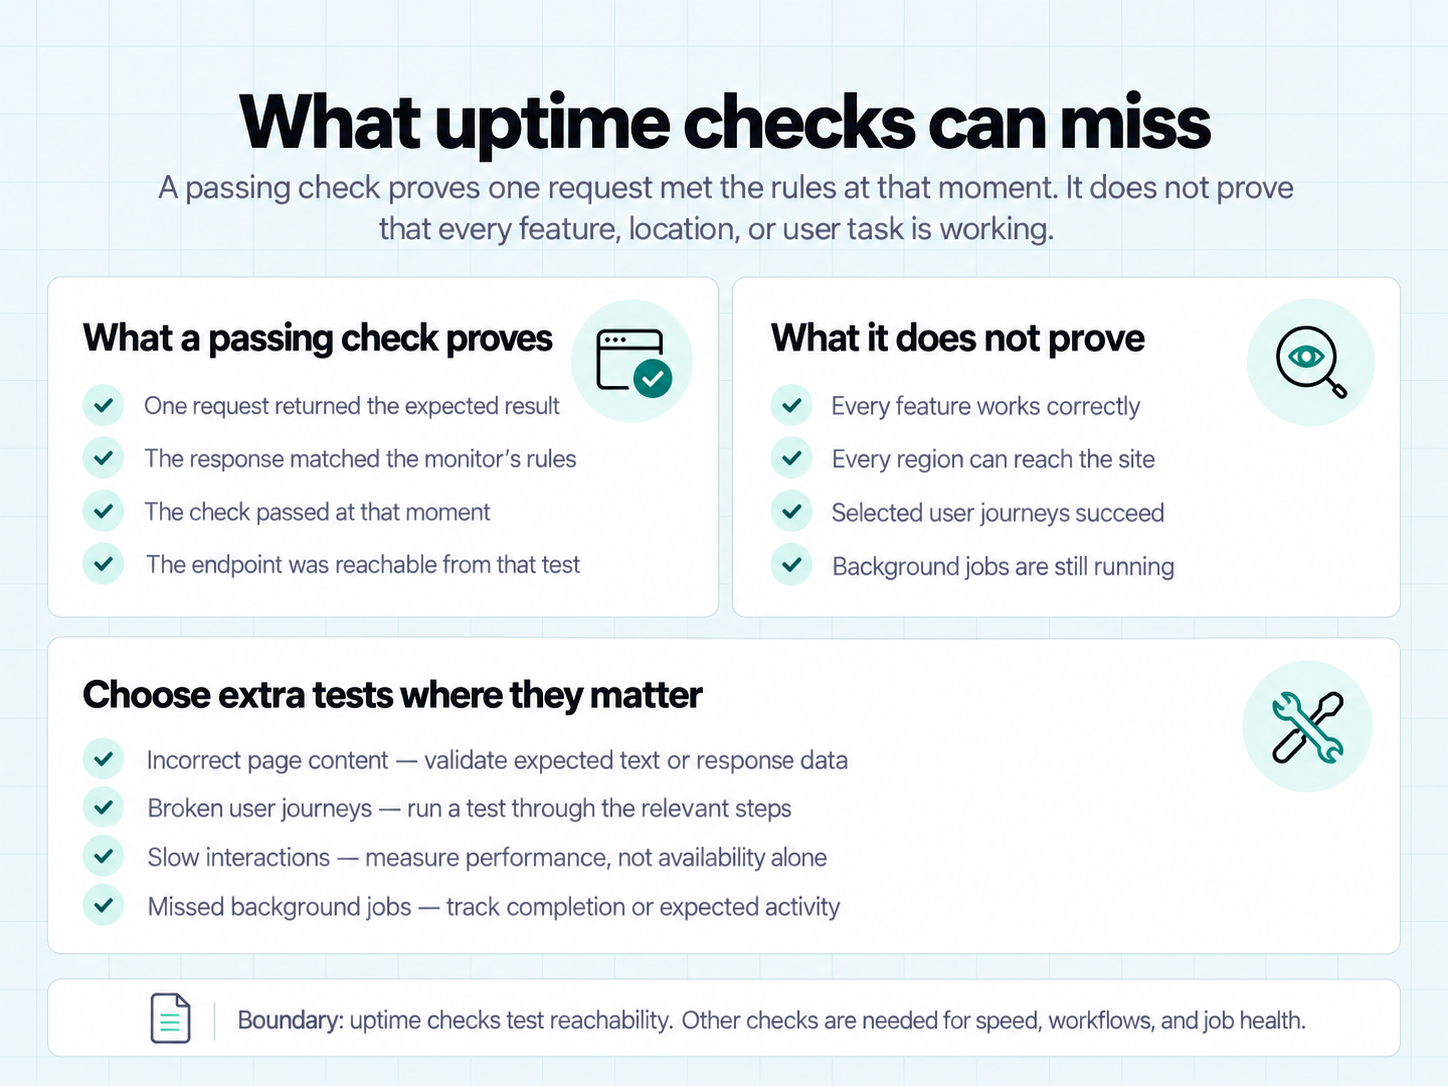
A passing check tells you that a particular request met the monitor’s rules at that moment. It does not confirm that every user can complete every task.
Understanding that boundary helps you choose additional tests where they matter.
A Successful Response Can Hide a Broken Feature
The HTTP specification defines 200 OK as success for a particular request. That does not confirm that every feature works. Your report dashboard might load normally, even though the background job that generates new reports has stopped running.
A basic check of that page may keep passing. Detecting the missing reports requires a different signal, such as tracking whether the job finishes on schedule.
Other gaps may need different checks:
- Incorrect page content: Look for expected text or validate response data.
- Broken user journeys: Use a test that performs the relevant steps.
- Slow interactions: Measure performance rather than availability alone.
- Missed background jobs: Track job completion or expected activity.
These capabilities vary by service. Check what a tool actually supports before assuming that “website monitoring” covers all of them.
One Location May Miss a Regional Problem
A successful check from one location does not prove your site is reachable everywhere.
Regional routing problems, content delivery network issues, or access restrictions can affect some visitors while leaving others unaffected. A monitor outside the affected area may continue to report success.
Checks from multiple locations can provide broader evidence. However, their alert rules matter: a service may notify you after one location fails or require agreement between locations.
For a small product, choose coverage based on where your users are and which failures you need to detect. Keep the distinction clear: availability checks test reachability, performance monitoring measures speed, and workflow tests check whether selected tasks succeed.
How to Choose an Uptime Monitoring Service
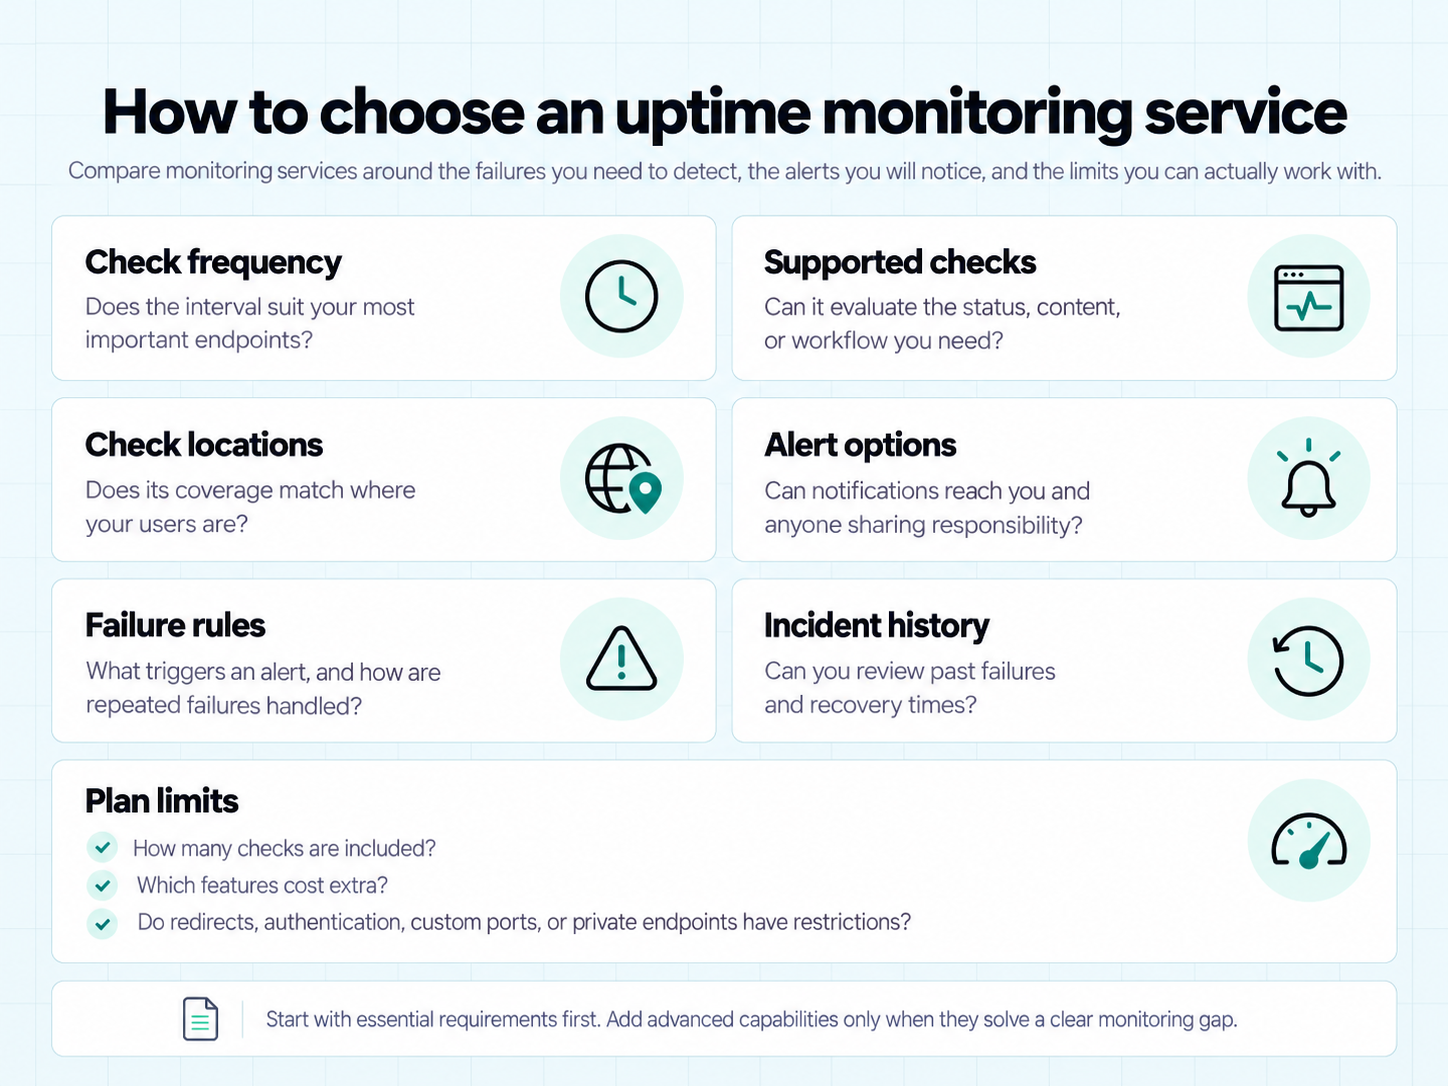
Choose a service around the failures you need to detect and the way you’ll respond. A long feature list matters less than checks you understand and alerts you’ll notice.
Before signing up, compare these details:
What to compare | What to ask |
Check frequency | Does the interval suit your most important endpoints? |
Supported checks | Can it evaluate the status, content, or workflow you need? |
Check locations | Does its coverage match where your users are? |
Alert options | Can notifications reach you and anyone sharing responsibility? |
Failure rules | What triggers an alert, and how are repeated failures handled? |
Incident history | Can you review past failures and recovery times? |
Plan limits | How many checks are included, and which features cost extra? |
Also check URL restrictions. Support for redirects, authentication, custom ports, and private endpoints varies between services.
If you ask me, start with your essential requirements. Add advanced capabilities when they address a clear gap in your monitoring.
Where AppKeepr Fits for Small Teams
AppKeepr brings endpoint availability alerts into the same inbox as messages from your code and connected tools.
It checks supported public URLs every 60 seconds and creates Down and Back online messages when their availability changes. Subscribe to the destination channel to receive notifications.
For solo founders and micro SaaS teams, this offers a simple way to follow availability alongside other product updates. Check the uptime documentation for supported URLs and check settings.
What to Do When a Downtime Alert Arrives
An alert tells you that a check failed. Your next task is to understand the impact and restore the affected service.
Work through these steps:
- Verify the failure. Review the failed URL and error. Check it independently, remembering that your connection may produce a different result from the monitor.
- Identify the impact. Determine which pages or features are affected. Is the whole application unreachable, or is the failure limited to one endpoint?
- Review recent changes. Look at deployments, configuration changes, and relevant logs. Check dependency status pages where appropriate.
- Take the safest recovery action. If evidence points to a recent deployment, consider a rollback. Check whether database or configuration changes make that rollback safe.
- Confirm recovery. Watch for a successful monitoring result, then test the affected feature. A recovery message alone does not verify the complete user experience.
- Record what happened. Note the cause, impact, and fix. Adjust your checks if the incident exposed a gap.
For longer incidents, keep affected users informed through your normal support or status channel. Share what you know and avoid promising a recovery time you cannot support.
After recovery, keep the review practical. Atlassian’s incident postmortem guidance recommends examining the incident and identifying actions to reduce recurrence. For a small team, even a brief record can turn today’s outage into a useful improvement.
Conclusion: Start With a Few Useful Checks
Site uptime monitoring gives you a way to discover availability problems while you focus on building your product. Start with the URLs your users depend on, choose suitable check settings, and test that notifications reach you.
Keep each check’s limits in mind. A reachable endpoint is useful evidence, but essential workflows and background jobs may need their own tests.
You don’t need to monitor everything on day one. Build a manageable setup, then improve it as your product grows and incidents reveal gaps.
Ready to put your first checks in place? Get started with AppKeepr and bring uptime alerts into your product’s inbox.
Frequently Asked Questions About Site Uptime Monitoring
Site uptime monitoring checks a website or API at regular intervals to see whether it responds as expected. A check may evaluate connection success, HTTP status, and response time against a timeout. When the result meets the service’s failure rules, it can trigger an alert. This helps you discover availability problems without checking manually, although it does not verify every feature of your product.
Choose a check interval based on how quickly you need to discover an outage. A one-minute interval provides more frequent observations than a five-minute interval, but neither guarantees immediate detection. Timeouts, failure confirmation, and notification delivery can add delay. For essential endpoints, prioritize shorter intervals where practical. Less critical pages may suit longer intervals, depending on your budget and the service’s options.
A free plan may be enough if it covers your essential URLs and delivers alerts through a channel you’ll notice. Compare check frequency, monitor limits, locations, and available notification methods before deciding. Also consider whether you need authenticated requests, content validation, or workflow tests. The right starting point depends on your product’s requirements; a paid plan only adds value when its capabilities address a real gap.
No. HTTP 200 means the server reports that the particular request succeeded. Your homepage might return 200 while a separately hosted API is unavailable, or a login page might load while sign-in fails. A monitor that checks only the status code cannot verify those other operations. Use additional endpoint checks, response validation, or workflow tests to cover important failures that a basic availability check can miss.
A one-time uptime checker tests a URL when you run it, giving you a result for that moment. Continuous uptime monitoring repeats checks on a schedule and can alert you when it detects failures or recovery. Despite the name, scheduled monitoring does not observe every instant: a short outage between checks may go unnoticed. Use a one-time checker for a quick investigation and ongoing monitoring to follow availability over time.
Rate this article
Share