- Published
- Reading time
- 12 min read
Website Uptime: What the Numbers Mean for Your SaaS
- Written by
- Türkü Şimşek

Website uptime describes how much of a defined period your website meets its availability criteria, usually expressed as a percentage. To interpret that number, you need to know what was checked, what counted as downtime, and how the reporting period was measured.
A dashboard showing 99.9% uptime looks reassuring. But what does that mean for the people using your product?
Did the checks cover your application or just the landing page? Was planned maintenance included? Could customers sign in while the monitor reported success?
For a solo founder or small SaaS team, these questions make the number useful. They help you judge reliability, choose a realistic target, and decide which failures deserve attention.
This guide explains how to calculate website uptime, translate percentages into downtime, and understand why reports can disagree. We’ll also look at practical ways to improve availability without taking on more than your team can maintain.
The Appkeepr Brief
- Define what “up” means. A reachable homepage does not prove that your entire product works.
- State the reporting period. An uptime percentage needs a clear window, such as a calendar month.
- Understand the calculation. Time-based availability and the percentage of successful checks can produce different results.
- Put percentages in context. Over a 30-day month, 99.9% uptime corresponds to 43 minutes and 12 seconds of downtime.
- Check exclusions and gaps. Planned maintenance and missing observations may be treated differently between reports.
- Choose targets around user impact. Consider customer needs, failure consequences, and your team’s ability to respond.
What Is Website Uptime?
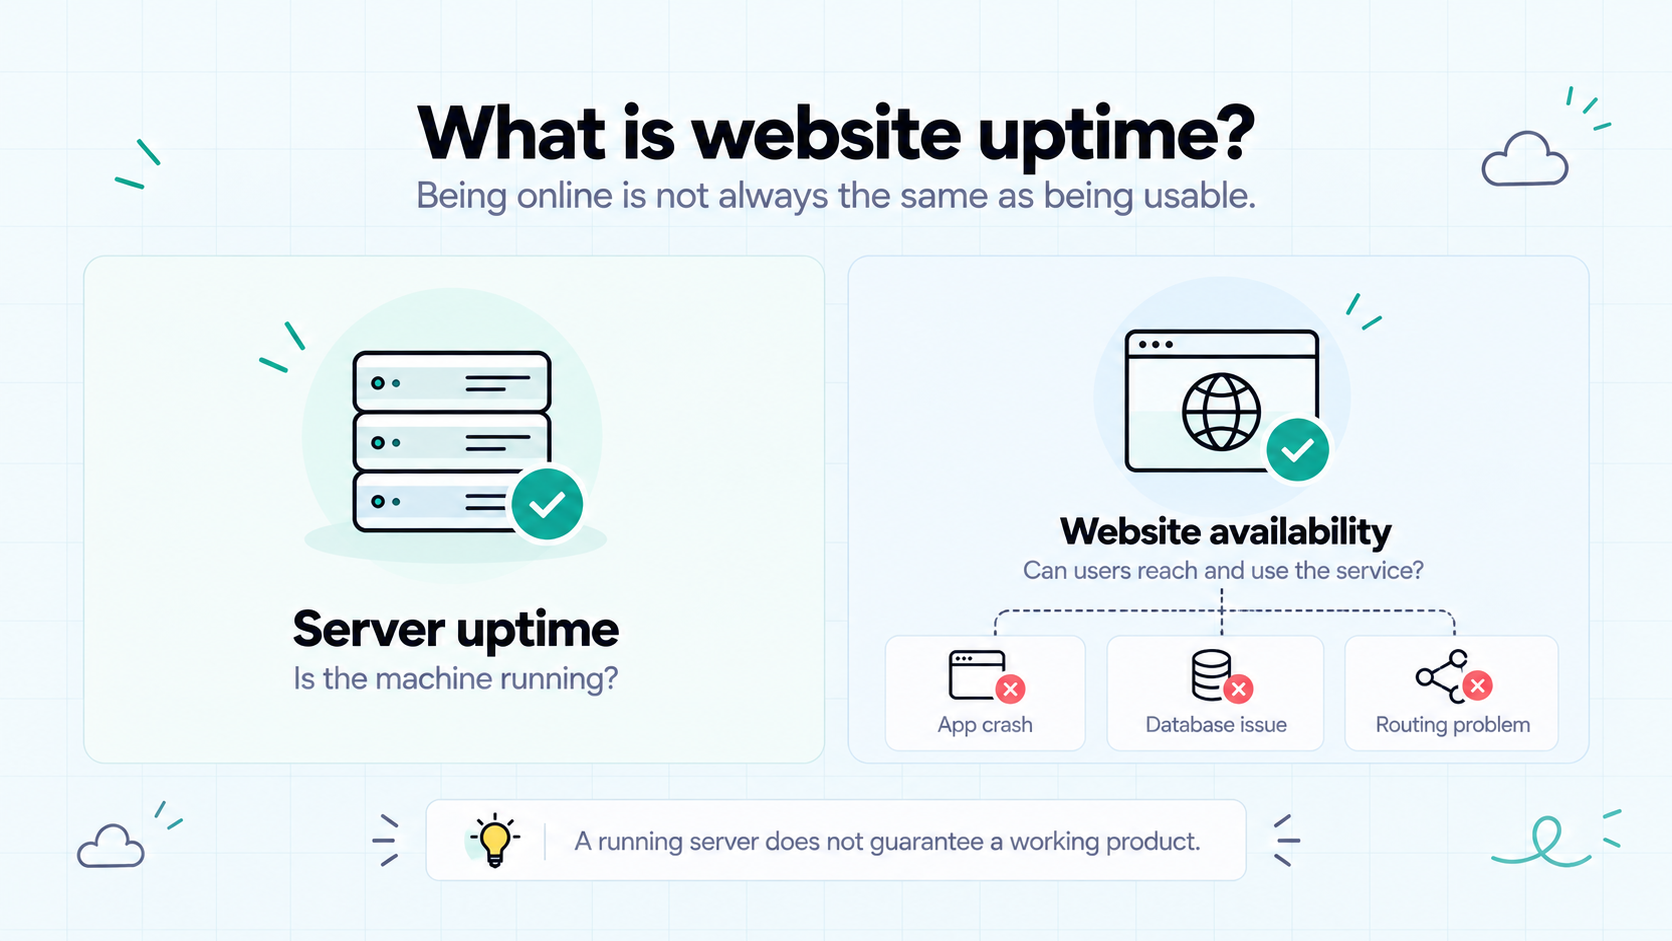
Website uptime describes the time your website meets defined availability conditions. Those conditions might require a page or API to return an expected response within a set timeout.
The definition matters because “online” can mean different things. A basic check may confirm that one URL responds. A broader test may verify that a customer can complete an important task.
Website Availability vs. Server Uptime
Server uptime usually describes how long a machine has been running without a restart. Website availability asks whether the service users need is accessible and meets its success criteria.
A server can keep running while your application crashes, a database becomes unavailable, or a routing problem blocks access.
The reverse is possible too. One server can restart while another continues serving requests. Your website may remain available throughout.
What Counts as Downtime?
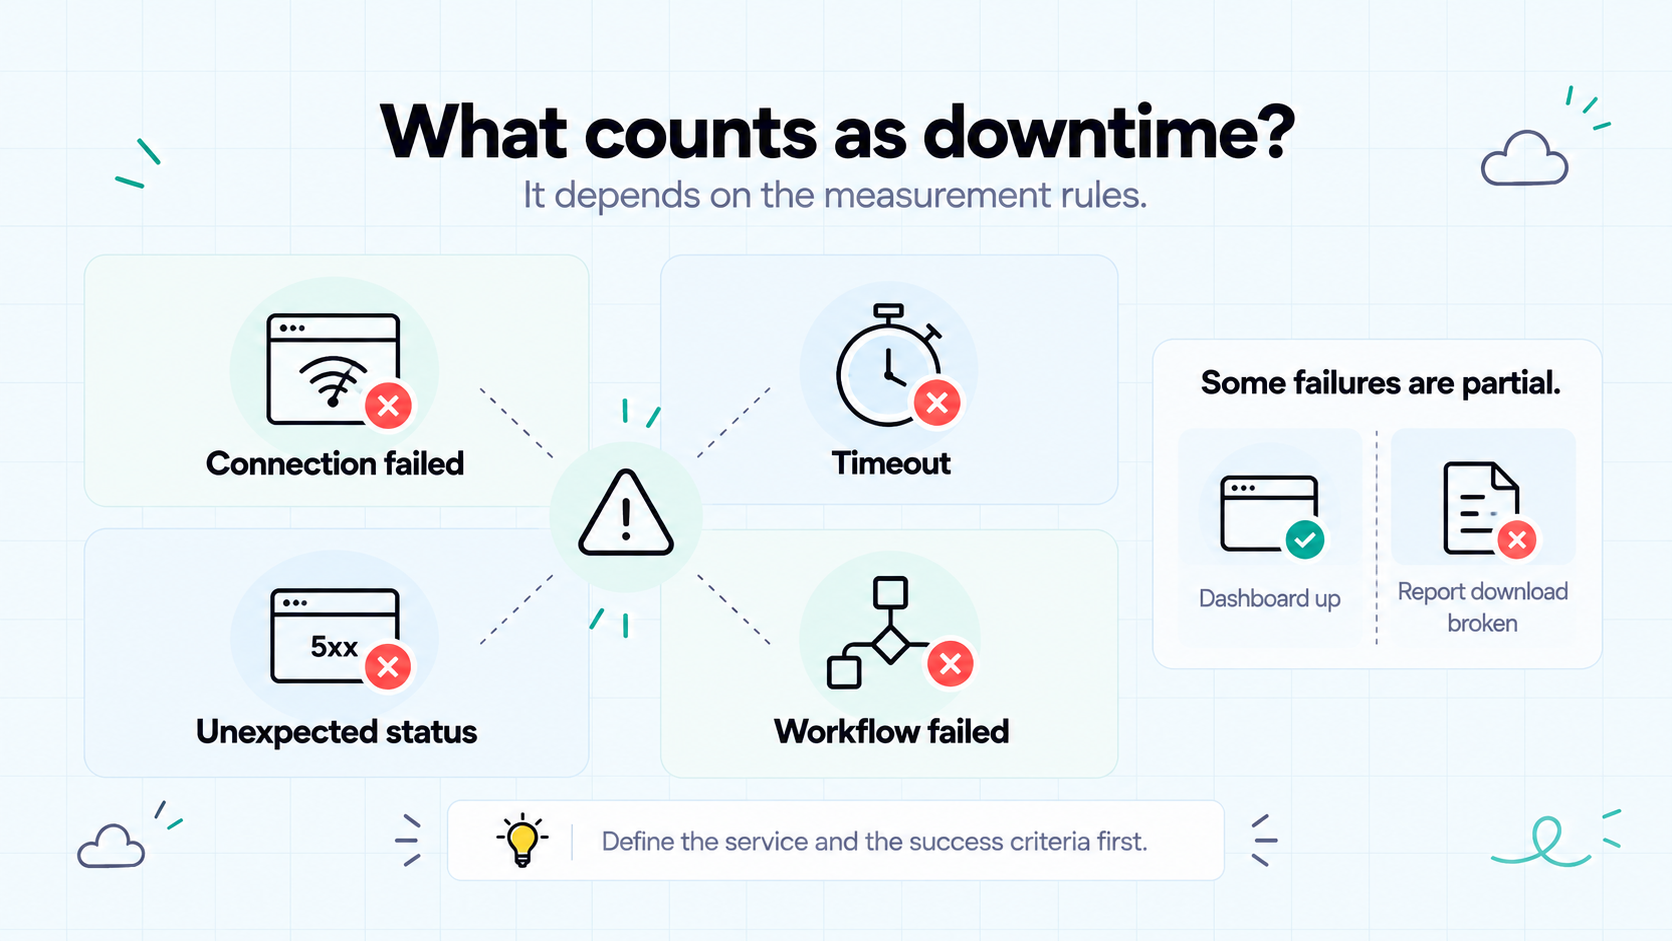
Downtime depends on the measurement rules. Examples include:
- A connection cannot be established.
- A response exceeds the allowed timeout.
- An endpoint returns an unexpected status.
- A tested workflow fails to complete.
Partial failures need context. If report downloads fail while the dashboard remains accessible, the product has an availability problem for that function. A homepage check may never detect it.
Before calculating website uptime, define which service you are measuring and what a successful result looks like. Otherwise, the percentage can hide the failures your customers experience.
How to Calculate Website Uptime
To calculate time-based website uptime, subtract downtime from the reporting period. Divide the remaining time by the total period, then multiply by 100.
Uptime (%) = ((Total time − Downtime) ÷ Total time) × 100
This straightforward calculation assumes the whole period is accounted for, with no exclusions or unknown intervals.
Use a Defined Reporting Period
Choose a clear window, such as a calendar month, and use the same units throughout.
Imagine your API records 60 minutes of downtime during a 30-day month. This is an illustrative example, not a measured result.
Measurement | Value |
Reporting period | 30 days |
Total minutes | 43,200 |
Recorded downtime | 60 minutes |
Calculated available time | 43,140 minutes |
Uptime | Approximately 99.861% |
The calculation is:
((43,200 − 60) ÷ 43,200) × 100 ≈ 99.861%
That percentage describes this API under the chosen measurement rules. It does not establish the availability of every feature in your product.
Understand What Your Monitoring Tool Measures
Some reports calculate availability from recorded incident durations. Others use the proportion of successful checks:
Successful checks (%) = (Successful checks ÷ Total evaluated checks) × 100
These methods are not automatically interchangeable. Extra checks during an incident or uneven sampling can change the successful-check percentage without a matching change in downtime duration.
Even time-based reports interpret observations. Scheduled checks do not reveal the exact instant an outage begins or ends.
Uptrends’ calculation documentation explains how its rules assign time between check results. It also documents how paused monitoring and maintenance settings affect its reported percentage.
Before using a report, confirm:
- Which endpoints and success criteria it covers.
- How it estimates failure and recovery times.
- Whether maintenance is included.
- How it handles missing observations.
Unknown time is not evidence that your website was available. If a report excludes it or counts it as uptime, disclose that treatment alongside the percentage.
What Do 99.9% and 99.99% Uptime Mean?
Small differences in uptime percentages can represent substantial differences in downtime. Moving from 99.9% to 99.99% leaves one-tenth as much downtime within the same reporting period.
The table below translates common targets into downtime equivalents.
Assumptions: A 30-day month, a 365-day year, continuous service expectations, and no excluded time. Values are rounded to the nearest second.
Uptime | Downtime per 30-day month | Downtime per 365-day year |
99% | 7 hours, 12 minutes | 3 days, 15 hours, 36 minutes |
99.9% | 43 minutes, 12 seconds | 8 hours, 45 minutes, 36 seconds |
99.95% | 21 minutes, 36 seconds | 4 hours, 22 minutes, 48 seconds |
99.99% | 4 minutes, 19 seconds | 52 minutes, 34 seconds |
You can calculate these values with:
Downtime = Total period × (1 − Uptime percentage ÷ 100)
These are mathematical equivalents. They do not predict how many incidents will occur or how long each incident will last.
For example, 99.9% uptime over a 30-day month could represent one outage lasting 43 minutes and 12 seconds. Several shorter outages could produce the same total.
The customer experience may differ considerably between those patterns. An outage during a busy booking window can affect more customers than one during a quiet period.
The reporting window matters too. Meeting an annual target does not prove that every month met the same percentage. A yearly figure can hide a particularly difficult month.
For a small SaaS, use the percentage alongside incident timing, affected features, and customer impact. The number gives you a useful summary. Those details explain what it meant for your users.
What Is a Good Website Uptime Target?
A good website uptime target reflects what your customers need and what your team can support. Neither 99.9% nor 99.99% is automatically the right choice for every SaaS.
Start with the consequences of failure, then decide how you will measure and meet the target.
Start With User Impact
Ask a few practical questions:
- What becomes unavailable? A marketing page and an essential customer API have different roles.
- Can customers wait? A delayed weekly report may have different consequences from a failed time-sensitive booking.
- When do customers depend on you? Consider their locations, working hours, and peak usage.
- What have you promised? Existing customer commitments should inform your reliability goals.
If your service is expected to work around the clock, quiet hours still belong in the reporting period. Tracking peak-hour impact separately can add context without hiding other downtime.
If you ask me, choose a target you can explain in terms of customer needs. Copying another company’s percentage tells you little about whether it suits your product.
Balance Reliability With Your Team’s Capacity
Tighter targets leave less room for failures. Meeting them may require faster detection, safer deployments, redundancy, and recovery procedures that work when you need them.
For a solo founder, a useful question is: “Can I detect and recover from a typical failure within this target’s downtime allowance?”
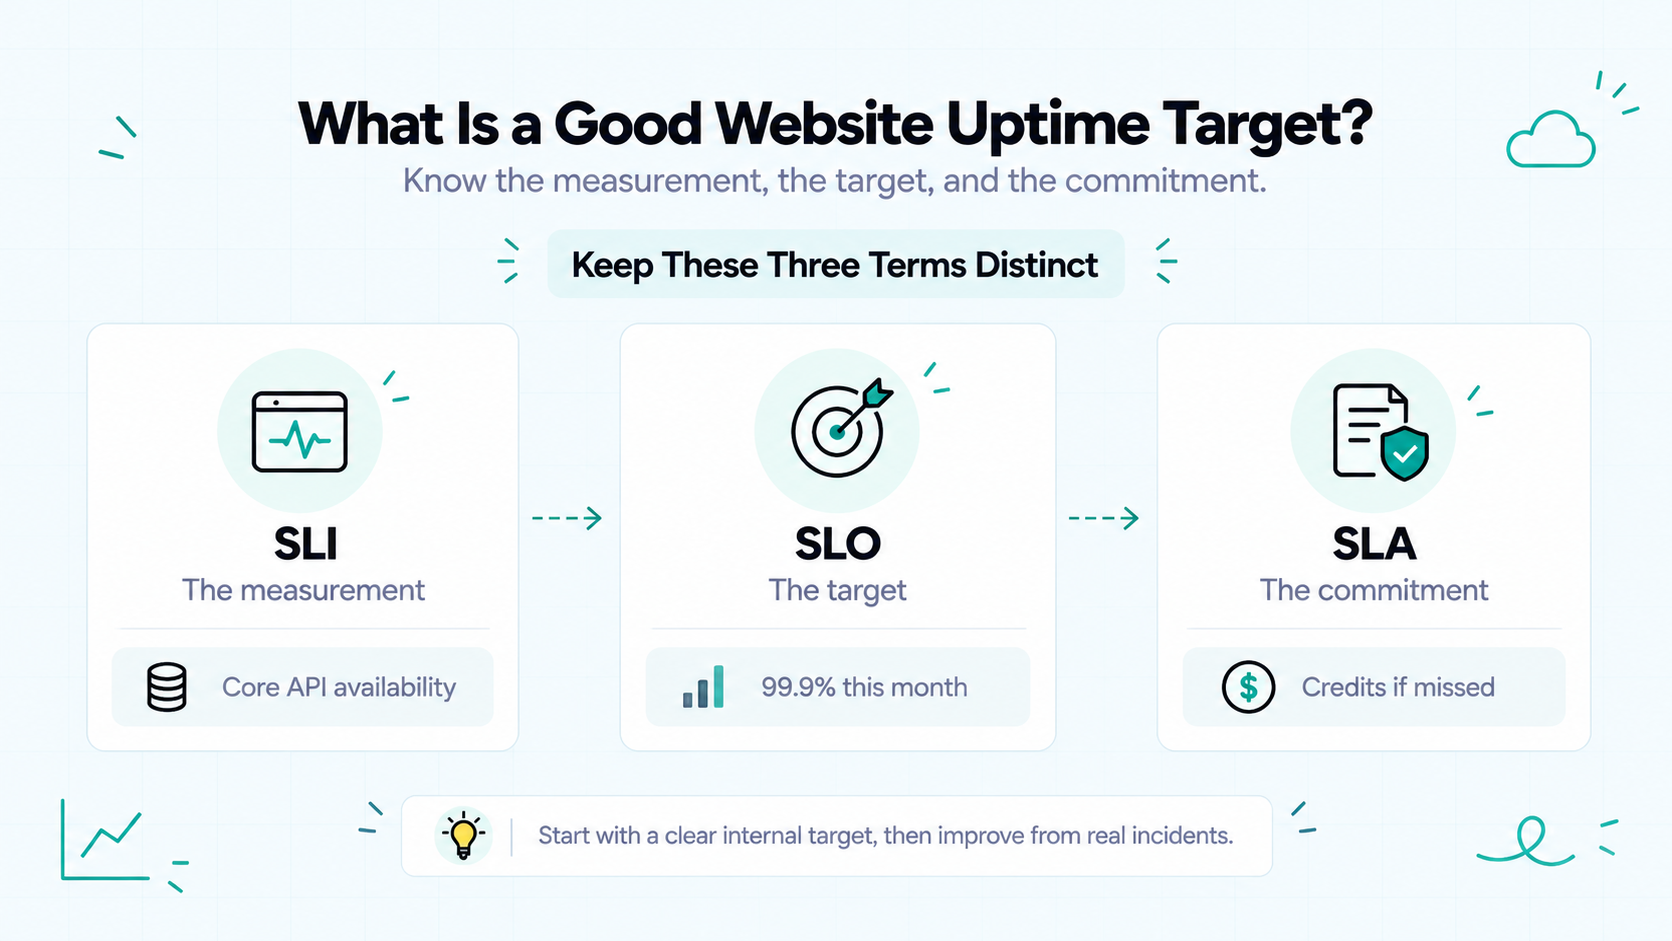
Keep these three terms distinct:
Term | Plain-language meaning | Example |
SLI: service level indicator | The defined measurement | Monthly time-based availability of your core API |
SLO: service level objective | The target for that measurement | At least 99.9% over a calendar month |
SLA: service level agreement | A service commitment with stated consequences | An agreement specifying credits if defined availability falls below its threshold |
Google’s SRE guidance explains these distinctions and recommends choosing measurements around behavior users care about.
Begin with a clearly defined internal target. Review actual incidents and recovery times, then improve the weaknesses they reveal. A more ambitious percentage becomes useful when you can support it with operational changes.
Why Uptime Reports Can Disagree
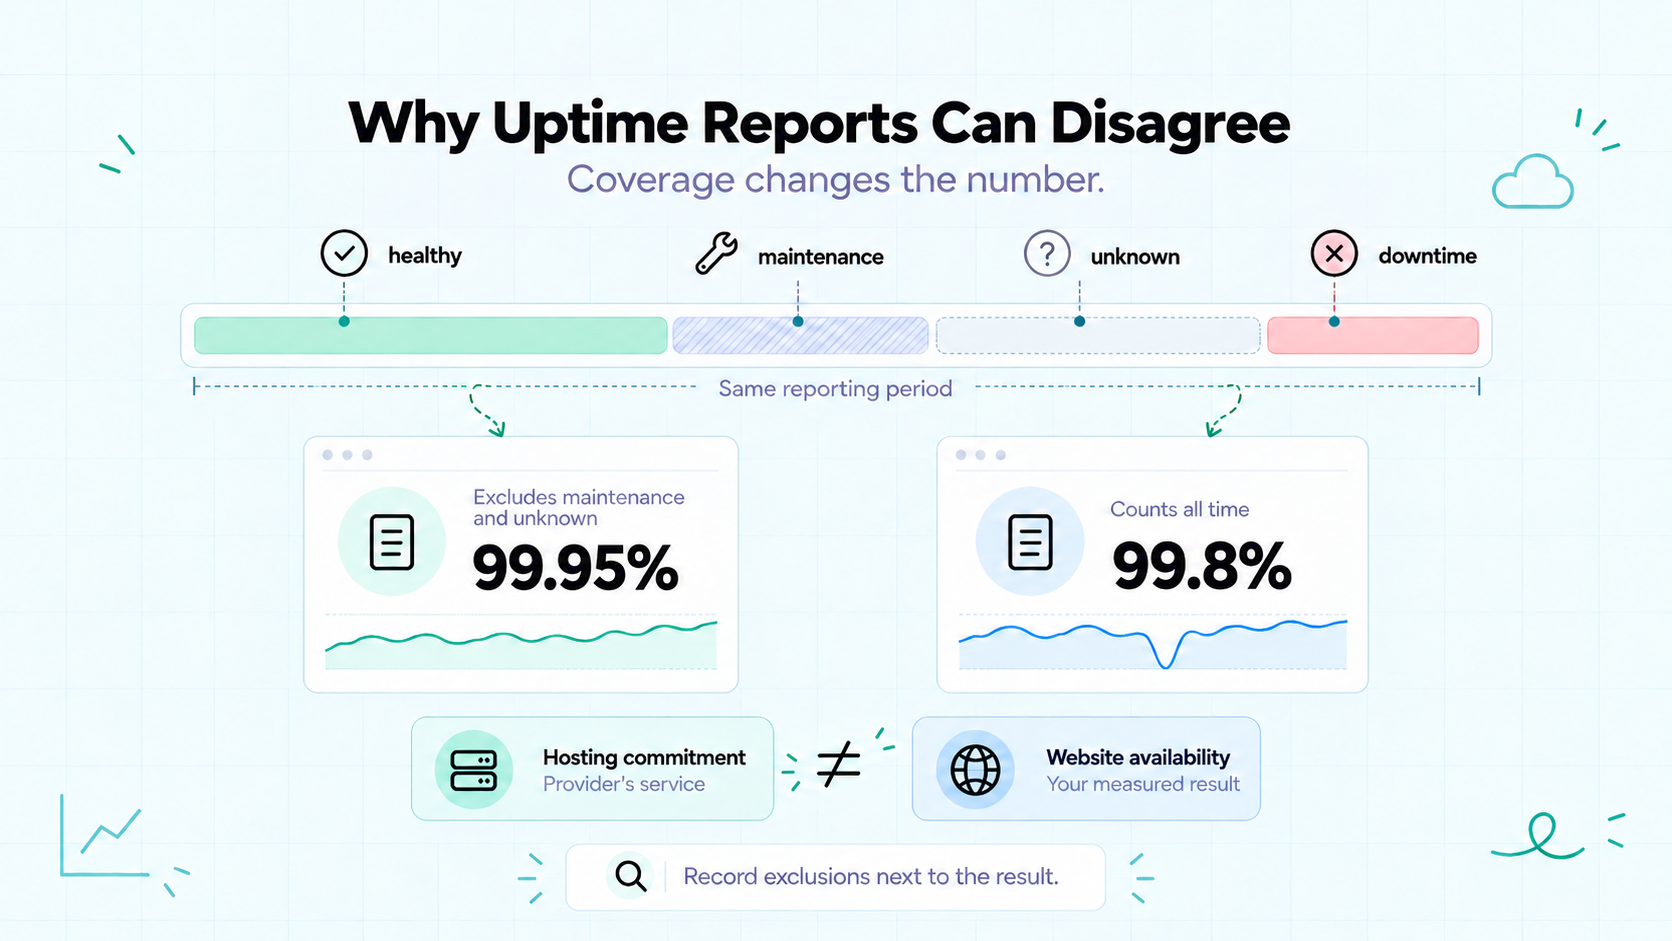
Two uptime reports can show different percentages for the same website without either calculation being wrong. They may observe different things or apply different rules.
Before comparing numbers, compare how they were produced.
Different Locations and Success Rules
A monitor in one region may reach your API while users elsewhere face a routing problem. A homepage check may pass while a test of report downloads fails.
Settings can change the result too:
Difference | How it can affect the report |
Selected endpoint | Different parts of the product may fail independently |
Check location | Regional problems may affect only some observations |
Timeout | A slow response may pass one check and fail another |
Expected response | A status-only check may pass content that another check rejects |
Check frequency | Short outages may appear in one report and go undetected in another |
Failure-confirmation rules also matter. Some services verify a failed observation before recording an incident. Others treat the first failure as the start.
The percentages describe availability under those rules. They are not interchangeable measurements of every customer’s experience.
Maintenance Exclusions and Monitoring Gaps
Scheduled maintenance may count as downtime in one report and be excluded from another. Missing observations may be marked unknown, removed from the calculation, or treated according to the provider’s reporting rules.
Record these choices alongside the result. A percentage without its coverage and exclusions can create a misleading impression.
Also distinguish your hosting provider’s commitment from your website’s measured availability. A hosting agreement may cover specific infrastructure components. Your product also depends on application code, DNS, databases, and other services.
A hosting credit does not restore a broken application, and an operational server does not prove that your customer workflow succeeds.
For useful comparisons, keep the reporting period, measured service, success criteria, and exclusions consistent. Where they differ, explain the difference before drawing conclusions.
How to Improve Website Uptime
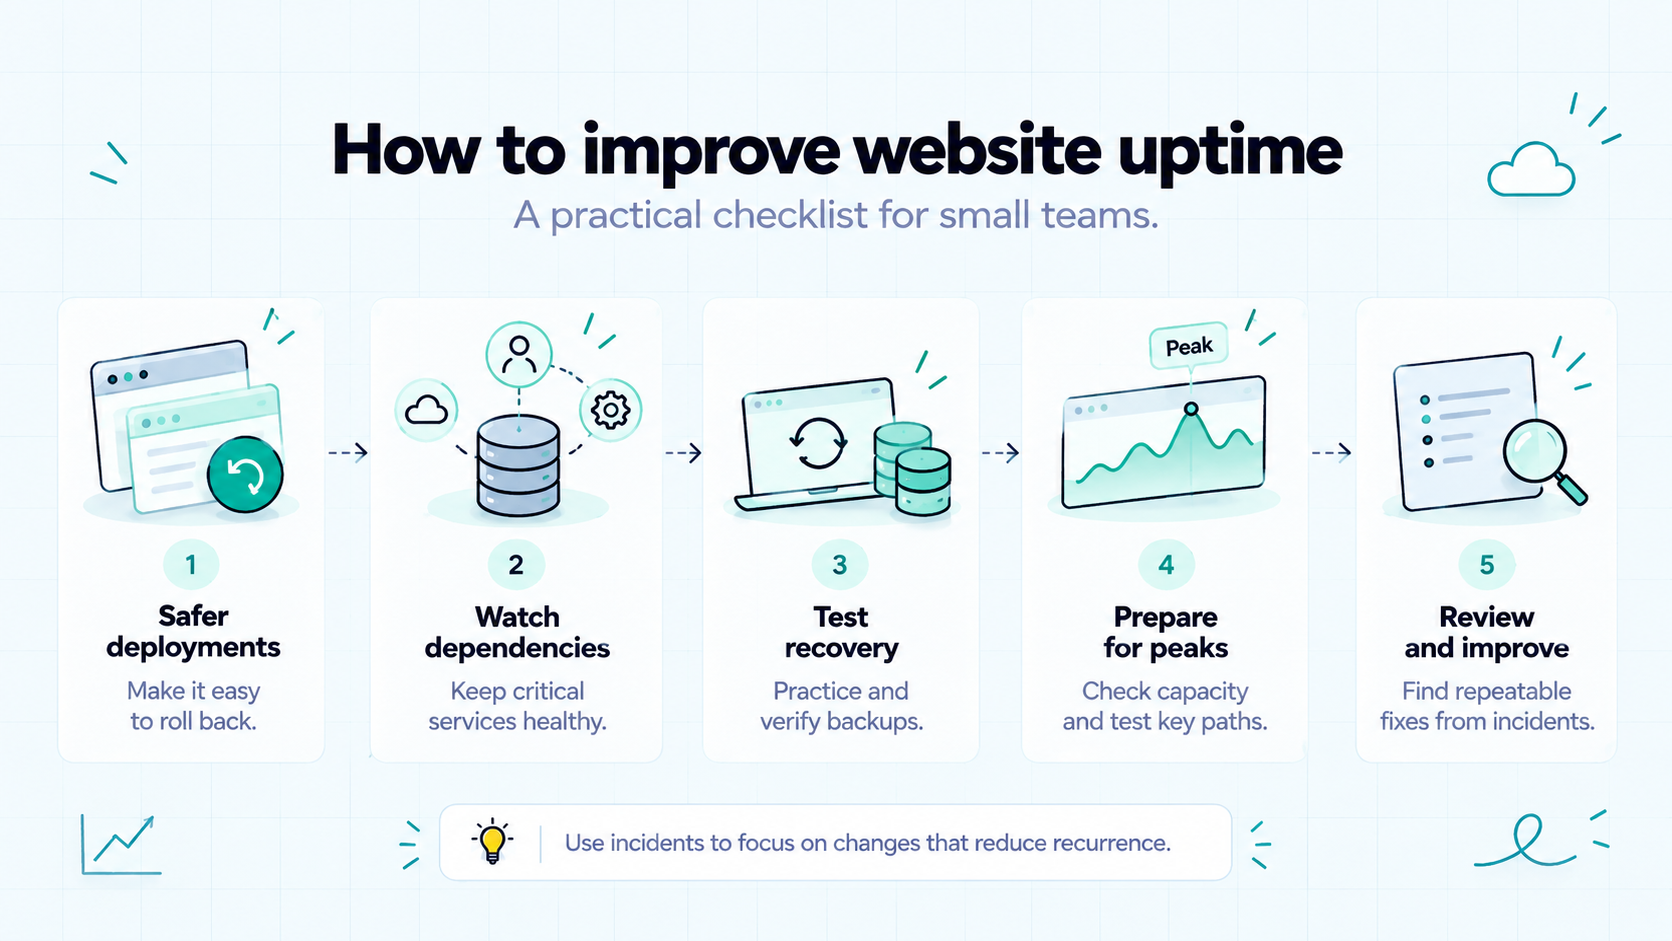
Improving website uptime means reducing failures and shortening the time it takes to recover. Start with the causes behind your own incidents rather than adding infrastructure without a clear purpose.
For a solo founder or micro SaaS team, this checklist provides a practical starting point:
- Make deployments easier to reverse. Keep a known working release available. Check whether database and configuration changes remain compatible before relying on rollback.
- Watch essential dependencies. Identify which database, authentication, or external service failures would stop users from completing important tasks.
- Test recovery procedures. Practice restoring service in a controlled environment. If recovery depends on backups, verify that you can restore them.
- Check capacity before predictable peaks. Review expected traffic and test important paths under representative load.
- Review incidents for repeatable fixes. Record the impact, contributing factors, and recovery steps. Assign a small number of concrete improvements.
Atlassian’s incident postmortem guidance explains how reviewing incidents helps teams identify actions that reduce recurrence. Even a short review can reveal an expired credential, fragile deployment step, or missing check.
If you ask me, fixing a recurring failure is often a better starting point than pursuing another nine in your target. Use incident evidence to decide where your next improvement belongs.
Where Appkeepr Fits
Appkeepr can help you notice failures in supported public endpoints. Its uptime checks run every 60 seconds with a ten-second timeout. HTTP 200–299 counts as healthy.
The first failed check creates a Down message. A successful check afterward creates a Back online message.
These signals support investigation and recovery. They do not restore the service themselves or verify every feature. Pair detection with a clear response plan and additional checks where your product needs them.
Conclusion: Give Your Uptime Number Context
Website uptime is useful when you understand what sits behind the percentage. Define the service you measure, state the reporting period, and explain how failures, exclusions, and missing data affect the result.
Choose a target around customer needs and your ability to respond. Then use incidents to guide improvements in deployment safety, dependency handling, and recovery.
For a small SaaS team, progress starts with consistent measurement and practical fixes. A higher percentage matters when it reflects fewer disruptions for the people using your product.
Ready to follow your essential endpoints? Get started with Appkeepr and receive downtime and recovery messages to support your response.
Frequently Asked Questions
Website uptime describes how much of a defined period your website meets its availability criteria. It is usually expressed as a percentage. The result depends on which endpoints or workflows are measured, what counts as a failure, and how observations are interpreted. A high percentage for one page does not establish that every feature worked throughout the reporting period.
For a time-based calculation, 99.9% uptime corresponds to 43 minutes and 12 seconds of downtime over a 30-day month. Over a 365-day year, it corresponds to 8 hours, 45 minutes, and 36 seconds. These figures assume continuous service expectations and no exclusions. They describe total downtime, not the number or length of individual incidents. Monthly and annual targets must be evaluated separately.
A measured period can show 100% uptime, but that does not guarantee uninterrupted availability in the future. Scheduled checks can also miss short outages or failures outside their coverage. A provider advertising a 100% uptime guarantee may offer a defined remedy if its commitment is missed. Read the measurement rules, exclusions, and consequences rather than treating the guarantee as proof that downtime cannot happen.
It depends on the reporting rules. A customer-facing availability measure can include maintenance that prevents users from accessing the service. A monitoring report or service agreement may exclude specified maintenance periods. State which approach you use and apply it consistently. Excluding maintenance can change the percentage, but it does not remove the disruption experienced by customers during that time.
Yes. A hosting provider may report healthy infrastructure while your application, database connection, DNS configuration, or another dependency fails. Its report may also cover a different location or service boundary. Measure the endpoints and workflows your customers rely on, and compare those results with the provider’s stated coverage. Infrastructure availability and the availability of your complete product are related, but they are not identical.
Rate this article
Share